SPATIAL INDIA FOR BANKING & FINANCIAL SERVICES
See where India`s next branch should be
Cross-reference banking density, population, economic activity, and 75+ indicators across 800+ districts. Census demographics enriched with NFHS-5 (2021) health data and NASA night-time lights (2024) for current economic signals. Identify underbanked micro-markets and shortlist expansion targets backed by district-level evidence.
WHY BRANCH PLANNING IS STILL GUESSWORK
Expansion decisions run on state-level averages
Your strategy team sees "UP is underbanked" — but UP has 75 districts with wildly different demographics, economic activity, and financial inclusion levels. State-level thinking leads to misallocated branches.
Internal GIS teams are expensive and slow
Building a district-level expansion model in-house means hiring GIS analysts, licensing enterprise GIS software (₹7L+/year), and waiting weeks for custom reports. Most expansion decisions are made faster than that.
Economic growth signals are invisible at district level
Which districts are brightening on satellite imagery — where new economic activity is emerging before it shows up in official statistics? That signal exists. It's just not on your expansion planning spreadsheet.
INTELLIGENCE FOR EXPANSION PLANNING
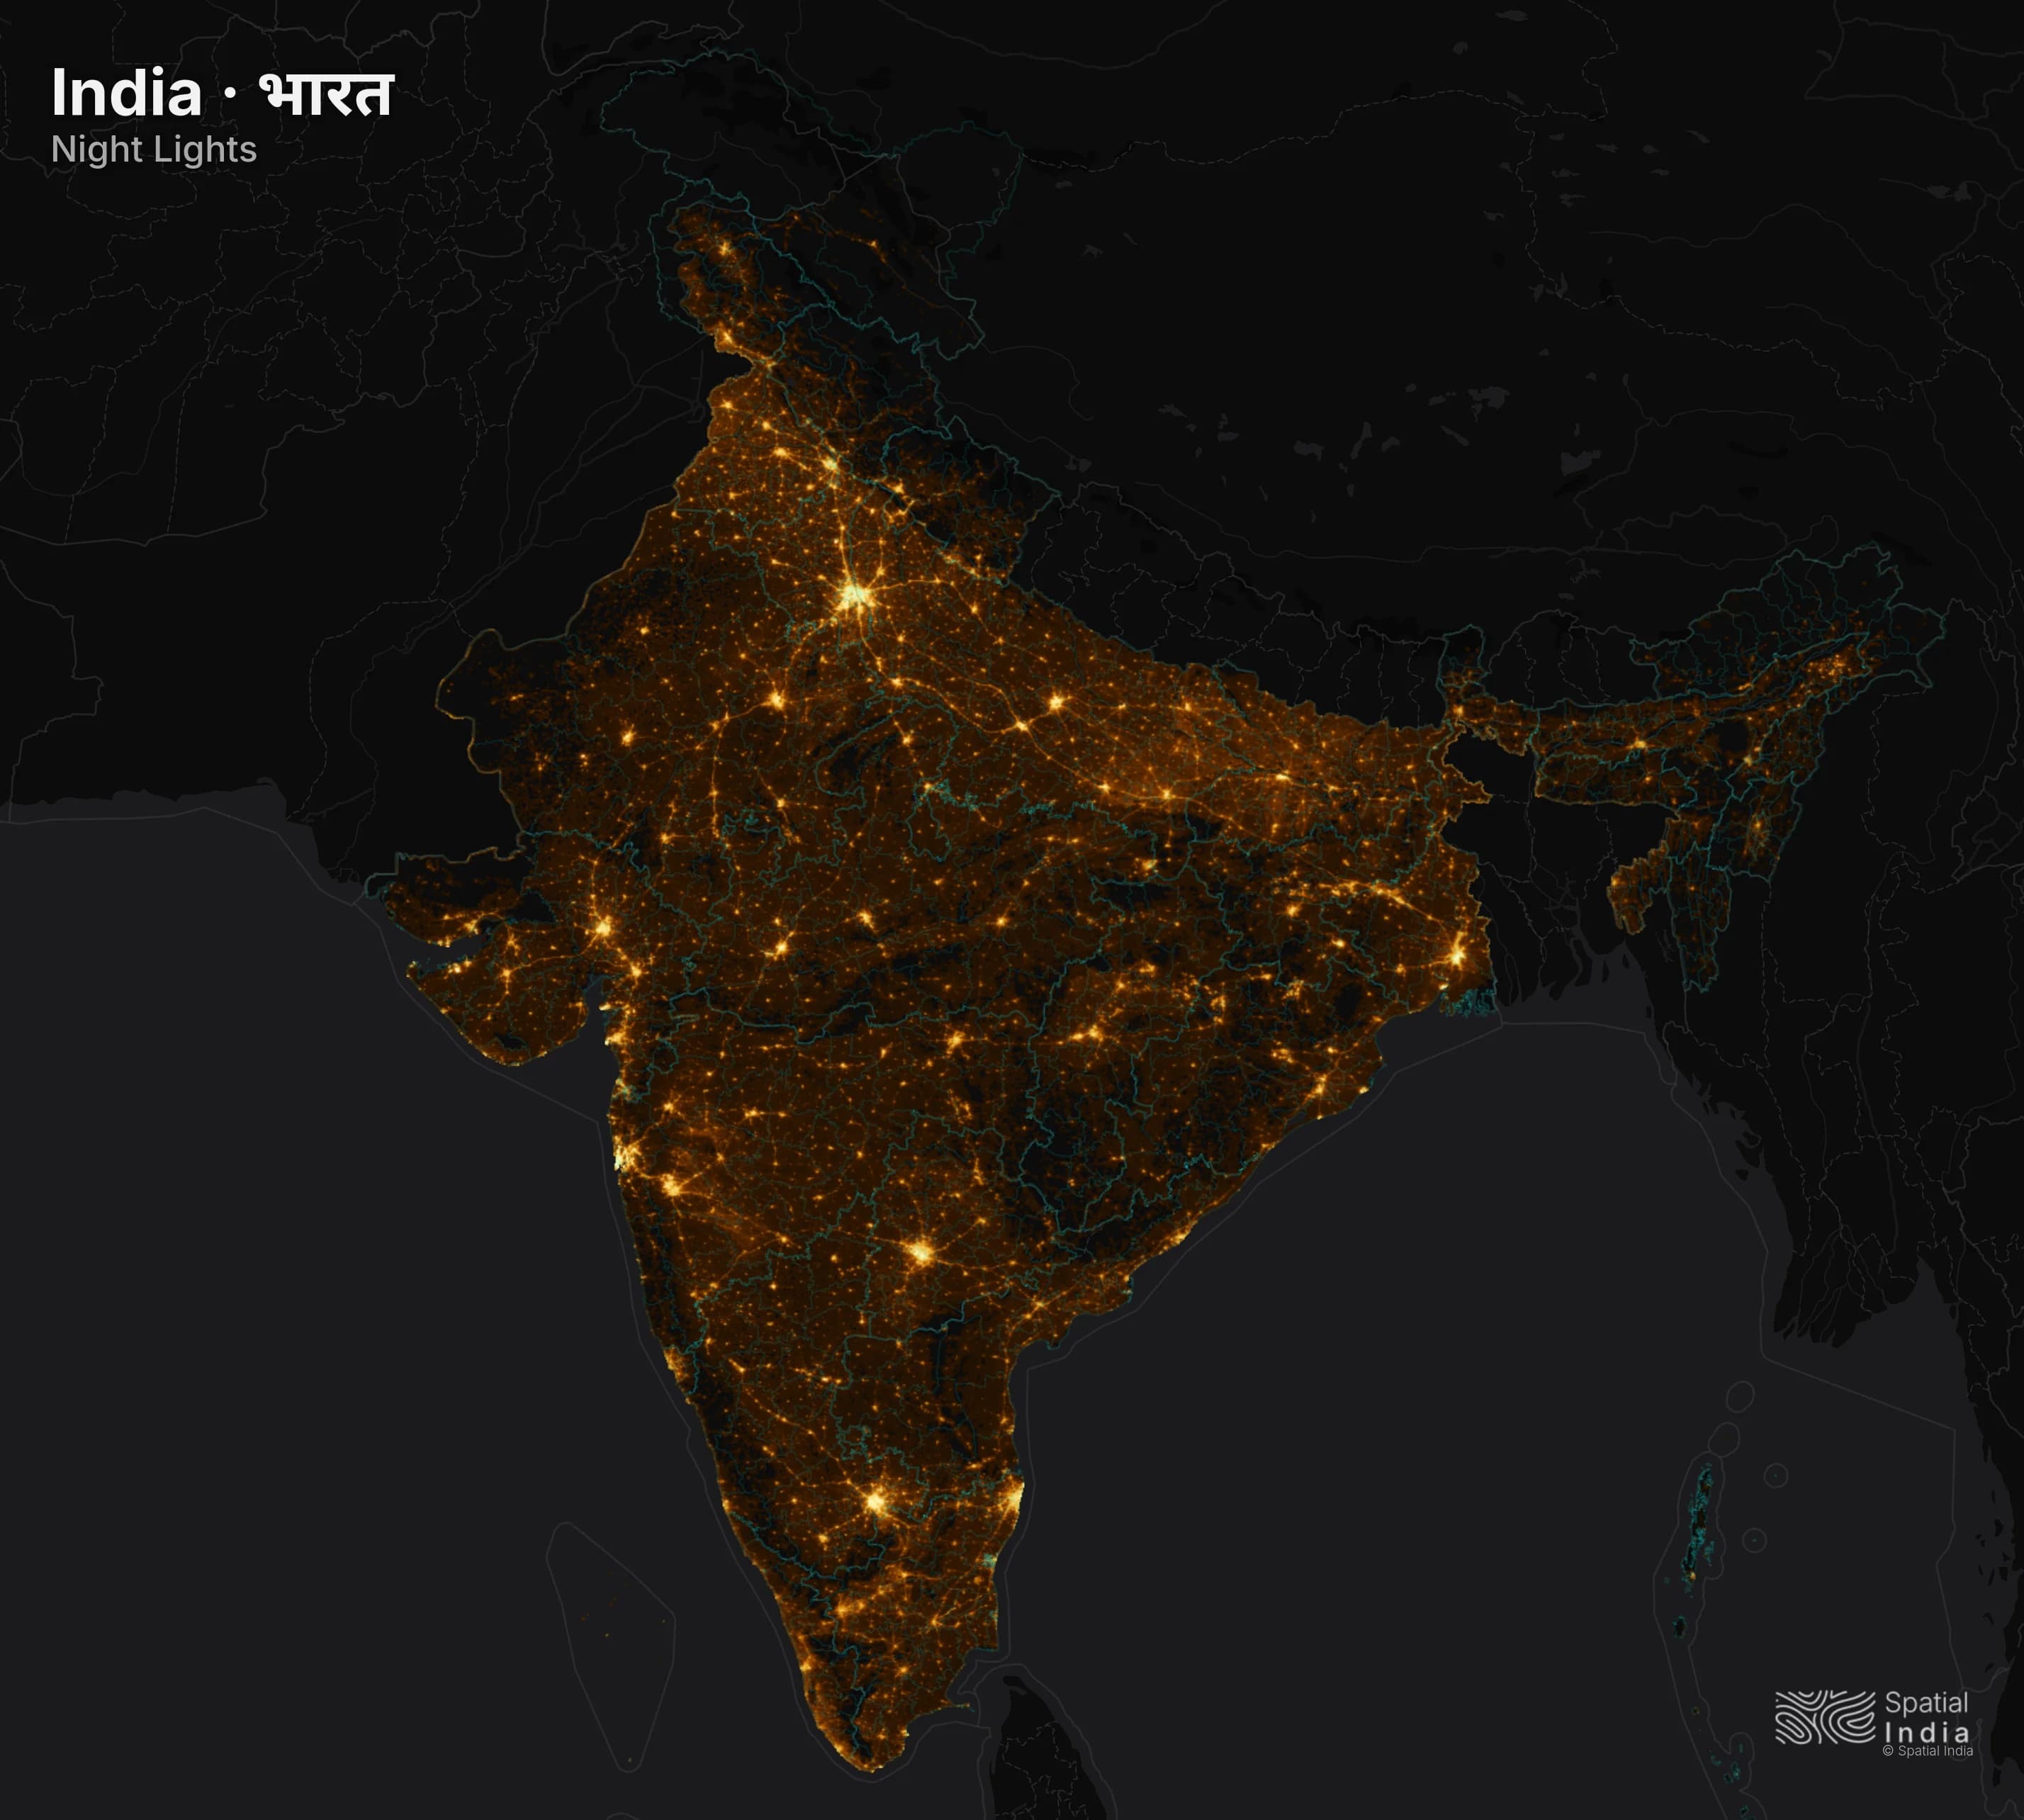
Night-time Lights (Growth Signal)
NASA satellite data showing district-level light intensity — a proven proxy for economic activity. Ten years of annual data (2015–2024). See which districts are brightening: that's where new banking demand is emerging.
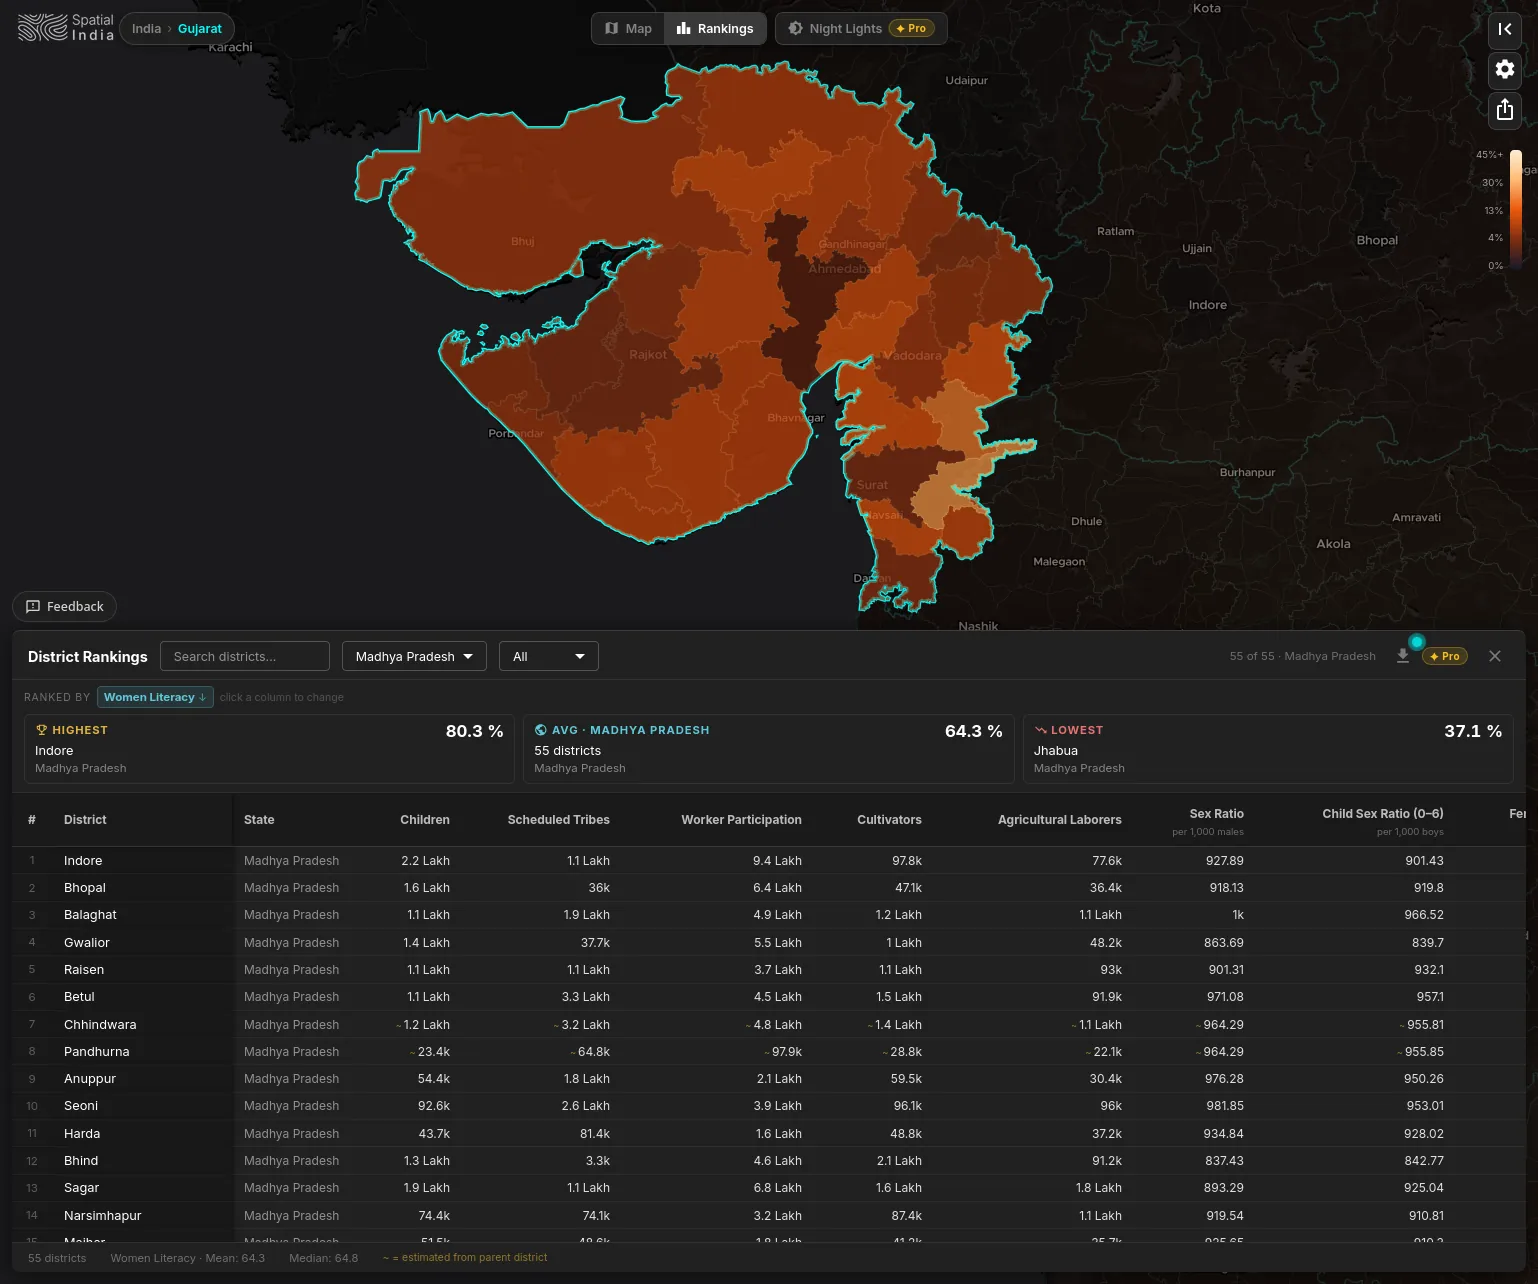
District Rankings (Shortlisting)
Rank all 800+ districts by banking density, population, or any other indicator. Filter by state. Find the bottom 100 on banking penetration — your greenfield opportunity list, generated in seconds.
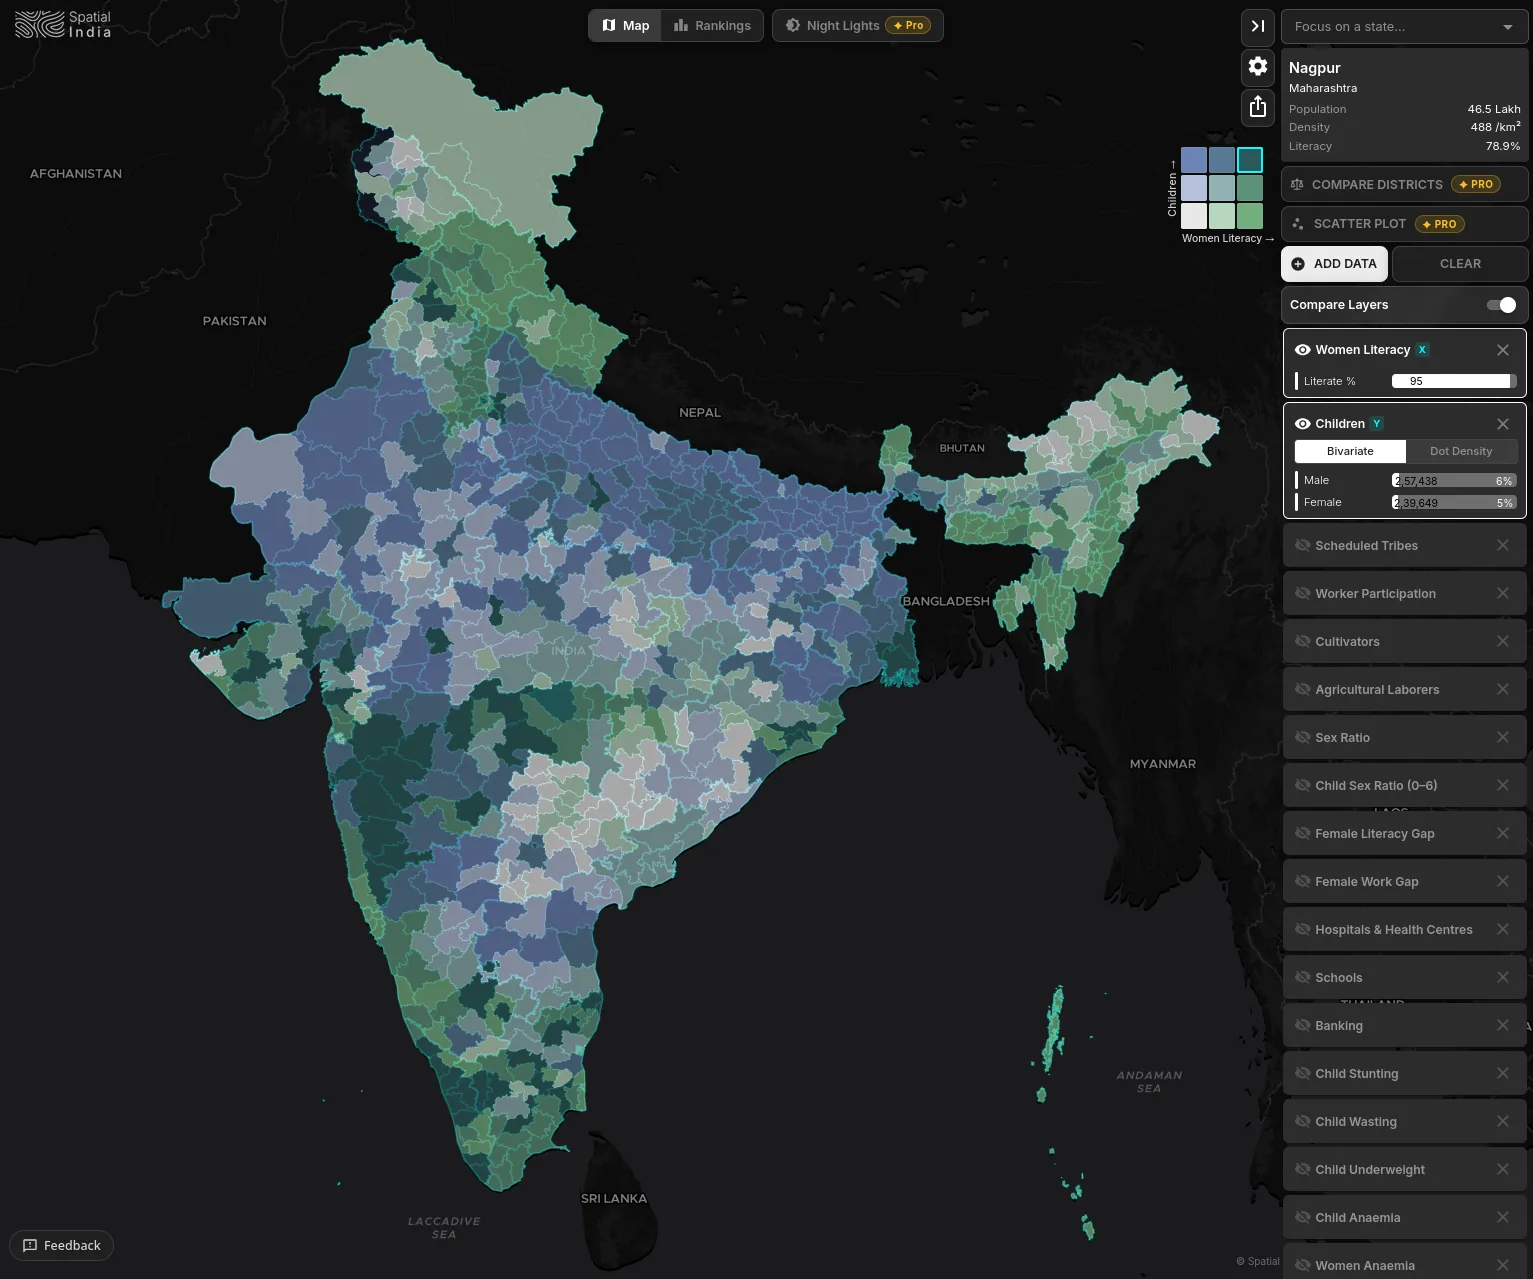
Bivariate Analysis (Gap Finder)
Map two variables simultaneously: high population + low banking density. High night-light intensity + few bank branches. The 3×3 colour matrix highlights exactly the districts where demand exceeds supply.
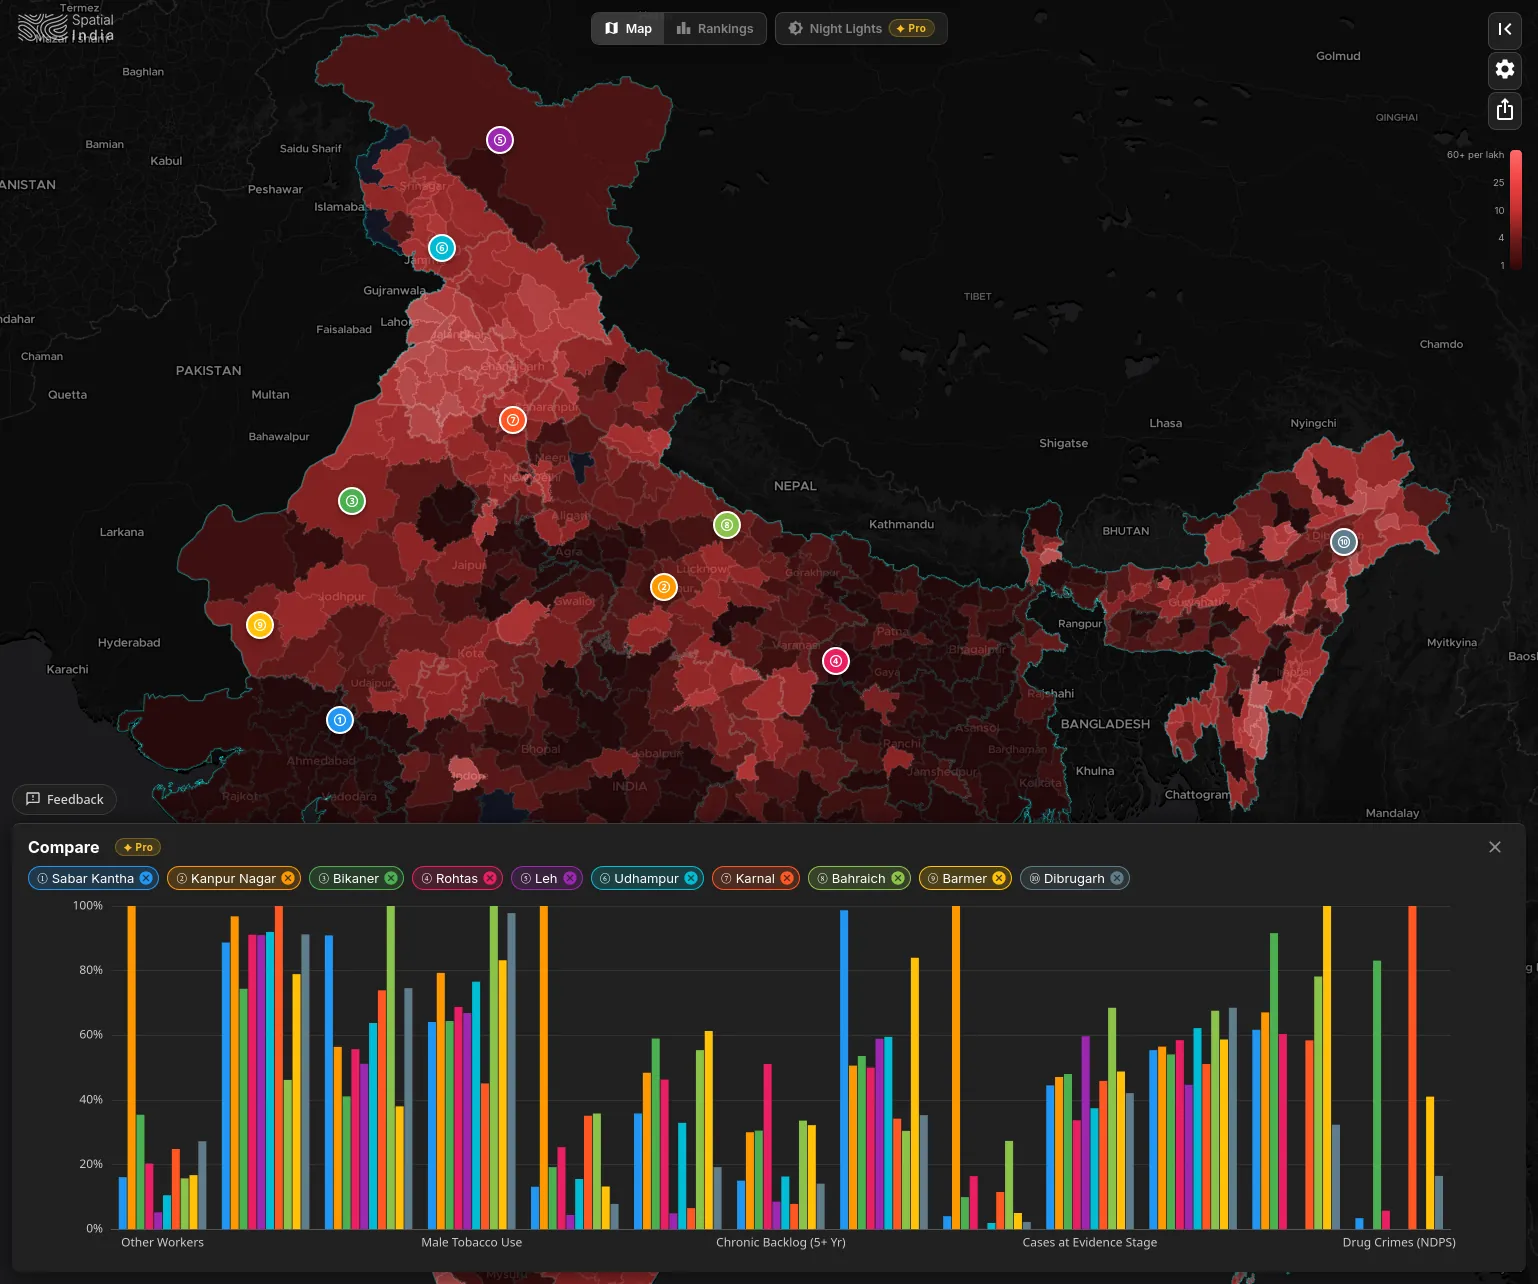
District Comparison (Due Diligence)
Pin your shortlisted districts and compare them side-by-side on population, literacy, economic activity, banking presence, and infrastructure. Normalised charts ready for your investment committee.
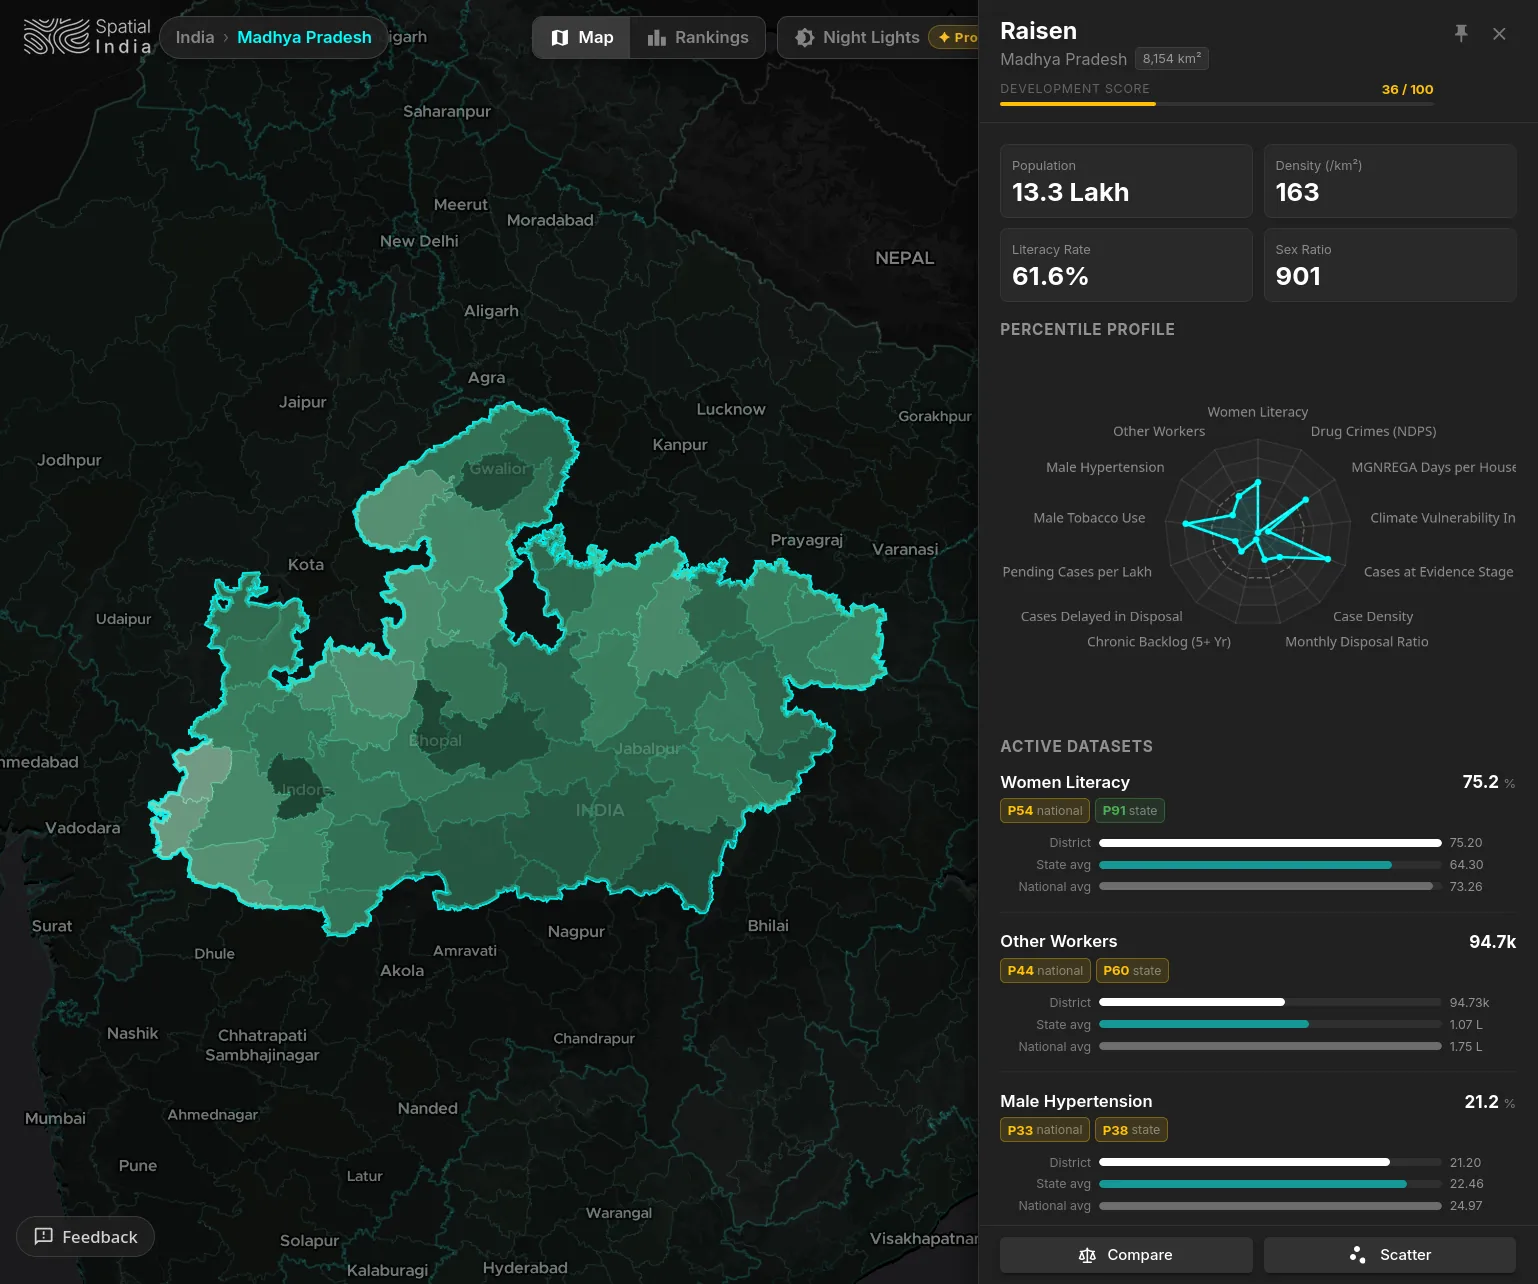
District Deep Dive
Click any district to open a full statistical profile: population, density, literacy, workforce composition, and a radar chart showing where it stands across every active indicator. See percentile rankings against state and national averages — a single-district assessment before your team visits the market.
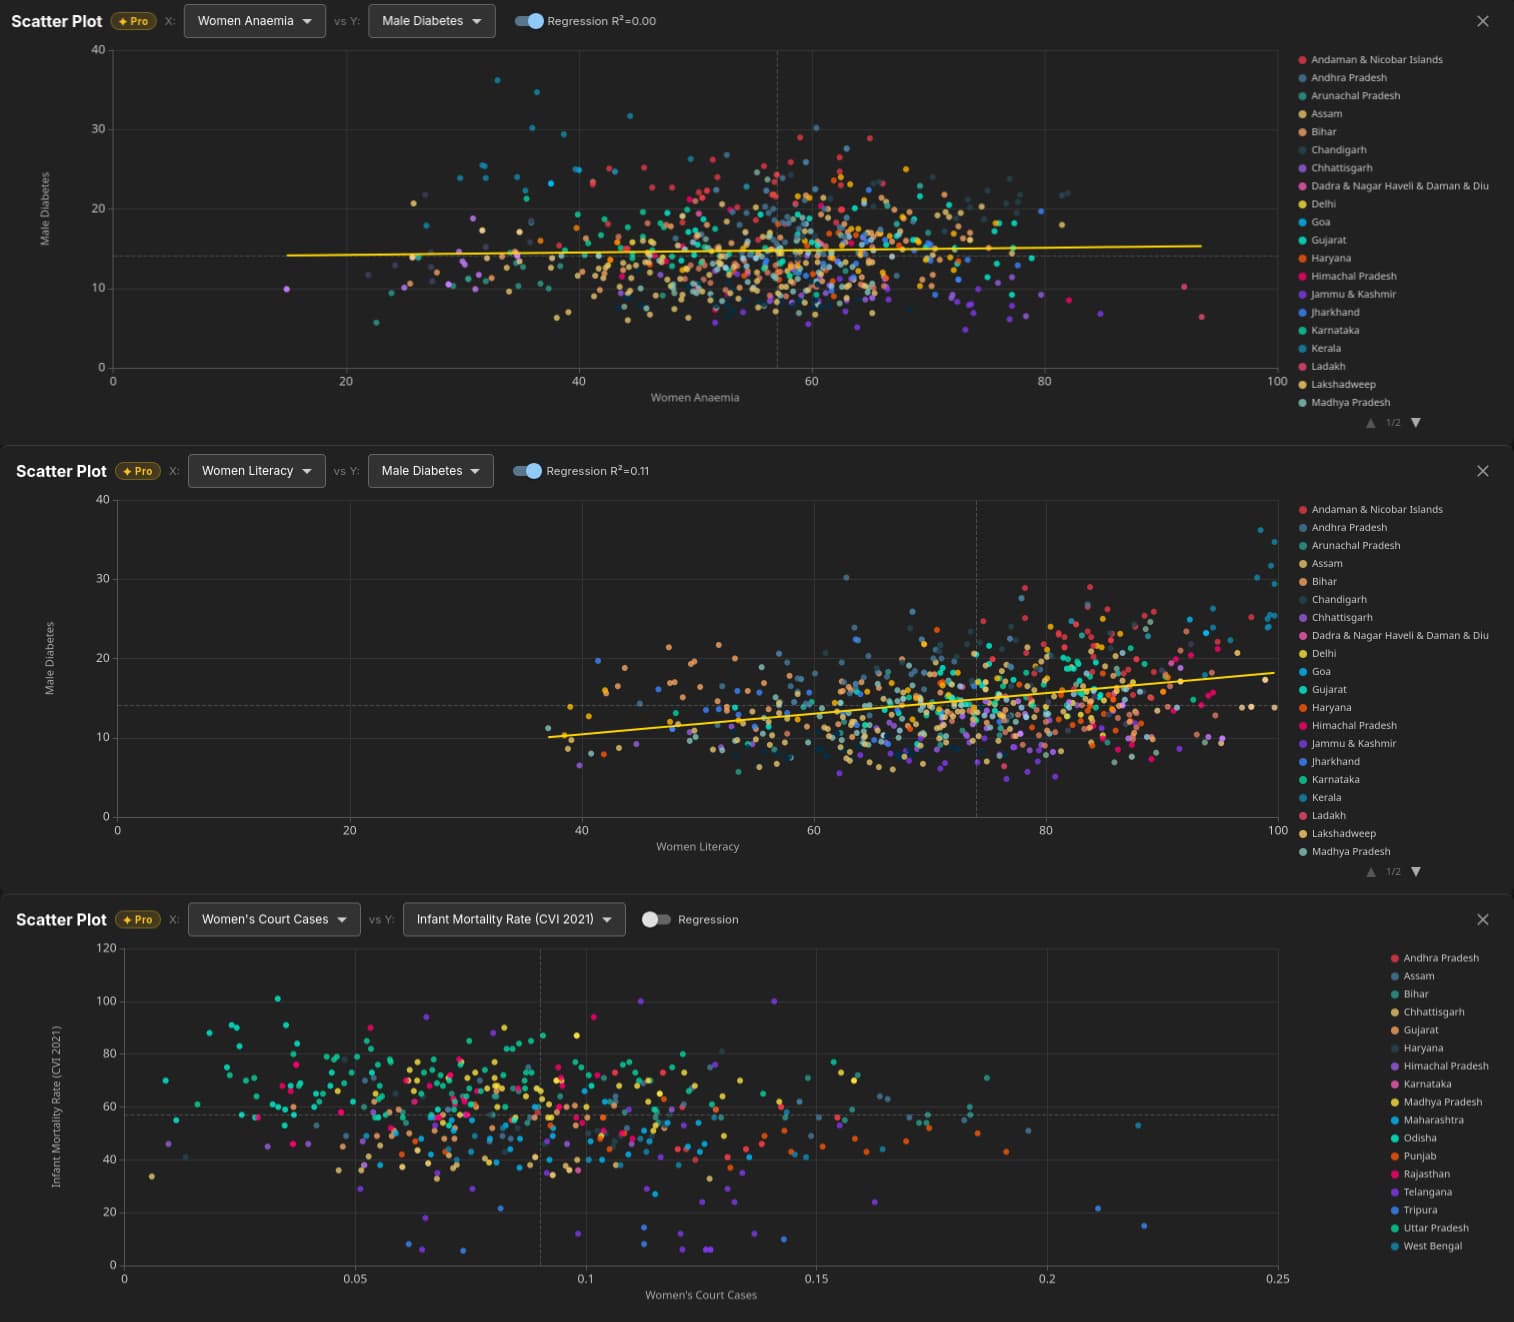
Scatter Plot Correlation
Plot banking density against population, night-light intensity against MSME registrations, or any two indicators against each other. Regression line with R² included. Find the districts where demand signals are strong but supply indicators are thin — your expansion white space, quantified.
THE METRICS THAT DRIVE BRANCH DECISIONS
WHAT YOUR EXPANSION TEAM CAN DO
Shortlist underbanked districts
Rank districts by banking density (low to high), filter by your target states, and cross-reference with population density and economic activity. Your next 50 branch locations — identified in one session.
Map economic growth signals
Overlay night-time lights to see which districts are gaining economic activity year over year. Compare 2015 vs 2024 to identify growth corridors. Emerging markets show up in satellite data before they appear in RBI reports.
Profile districts for risk assessment
Use the district profile to assess climate vulnerability, health infrastructure, and demographic stability. Pin candidate districts and compare their risk profiles side-by-side before committing capital.
BRANCH INTELLIGENCE WITHOUT ENTERPRISE COSTS
| Feature | Enterprise GIS Platforms | Retail Analytics Tools | Internal GIS Team | |
|---|---|---|---|---|
| Self-serve, no GIS team needed | Open browser, start exploring | (requires GIS training, ₹7L+/yr) | (retail-focused only) | |
| Economic activity signals | NASA VIIRS night lights 2015–2024 | (paid add-on) | (manual pipeline) | |
| Underbanked district identification | Banking density + population overlay | (custom project, weeks) | ||
| Two-variable gap analysis | High demand + low supply, mapped | (manual configuration) | (custom build) | |
| Side-by-side district due diligence | Pin up to 10 districts, compare instantly | (custom build) | ||
| 10+ national datasets, unified | Census, NFHS-5, MSME, lights & more | (paid add-ons) | (proprietary, closed) | (manual integration) |
| District ranking & shortlisting | Rank 800+ districts by any metric | (custom build) | ||
| Board-ready map exports | PNG with legend & source attribution | (manual cartography) | (manual) | |
| Census 2027 ready | Architecture ready, day-one support |
Spatial India vs Enterprise GIS Platforms
Spatial India vs Retail Analytics Tools
Spatial India vs Internal GIS Team
Your next 50 branches, shortlisted
Free during beta — currently in early access. No procurement, no GIS license, no developer required. Explore banking density, demographics, and economic activity across every district in India.
New district-level economic datasets — get early access.