SPATIAL INDIA FOR RESEARCHERS & ACADEMIA
Every Indian district. Every public dataset. One interactive map.
Explore spatial correlations across 75+ indicators — Census 2011, NFHS-5, night-time lights, judicial data, and more — without downloading a single shapefile. Scatter plots with regression, bivariate choropleth, percentile rankings, and CSV export included.
WHY DISTRICT-LEVEL RESEARCH IS STILL PAINFUL
Census data is still a folder of Excel files
India's Census portal distributes data as hundreds of Excel sheets — one table per indicator, per state. Joining them to district boundaries means manual fuzzy matching, name normalization, and boundary alignment. Before any analysis begins.
One choropleth map costs two hours of setup
Download the shapefile. Download the CSV. Open QGIS or fire up GeoPandas. Join on district codes that don't quite match. Fix the three districts that bifurcated after 2011. Style the colour ramp. Export. Repeat for the next indicator.
Cross-source analysis requires a data engineering project
Census 2011 has 640 districts. NFHS-5 has 707. Agricultural Census uses different naming conventions. Getting these into one analysis-ready table is a research project in itself — before the actual research starts.
ANALYTICAL TOOLS THAT EARN THEIR PLACE
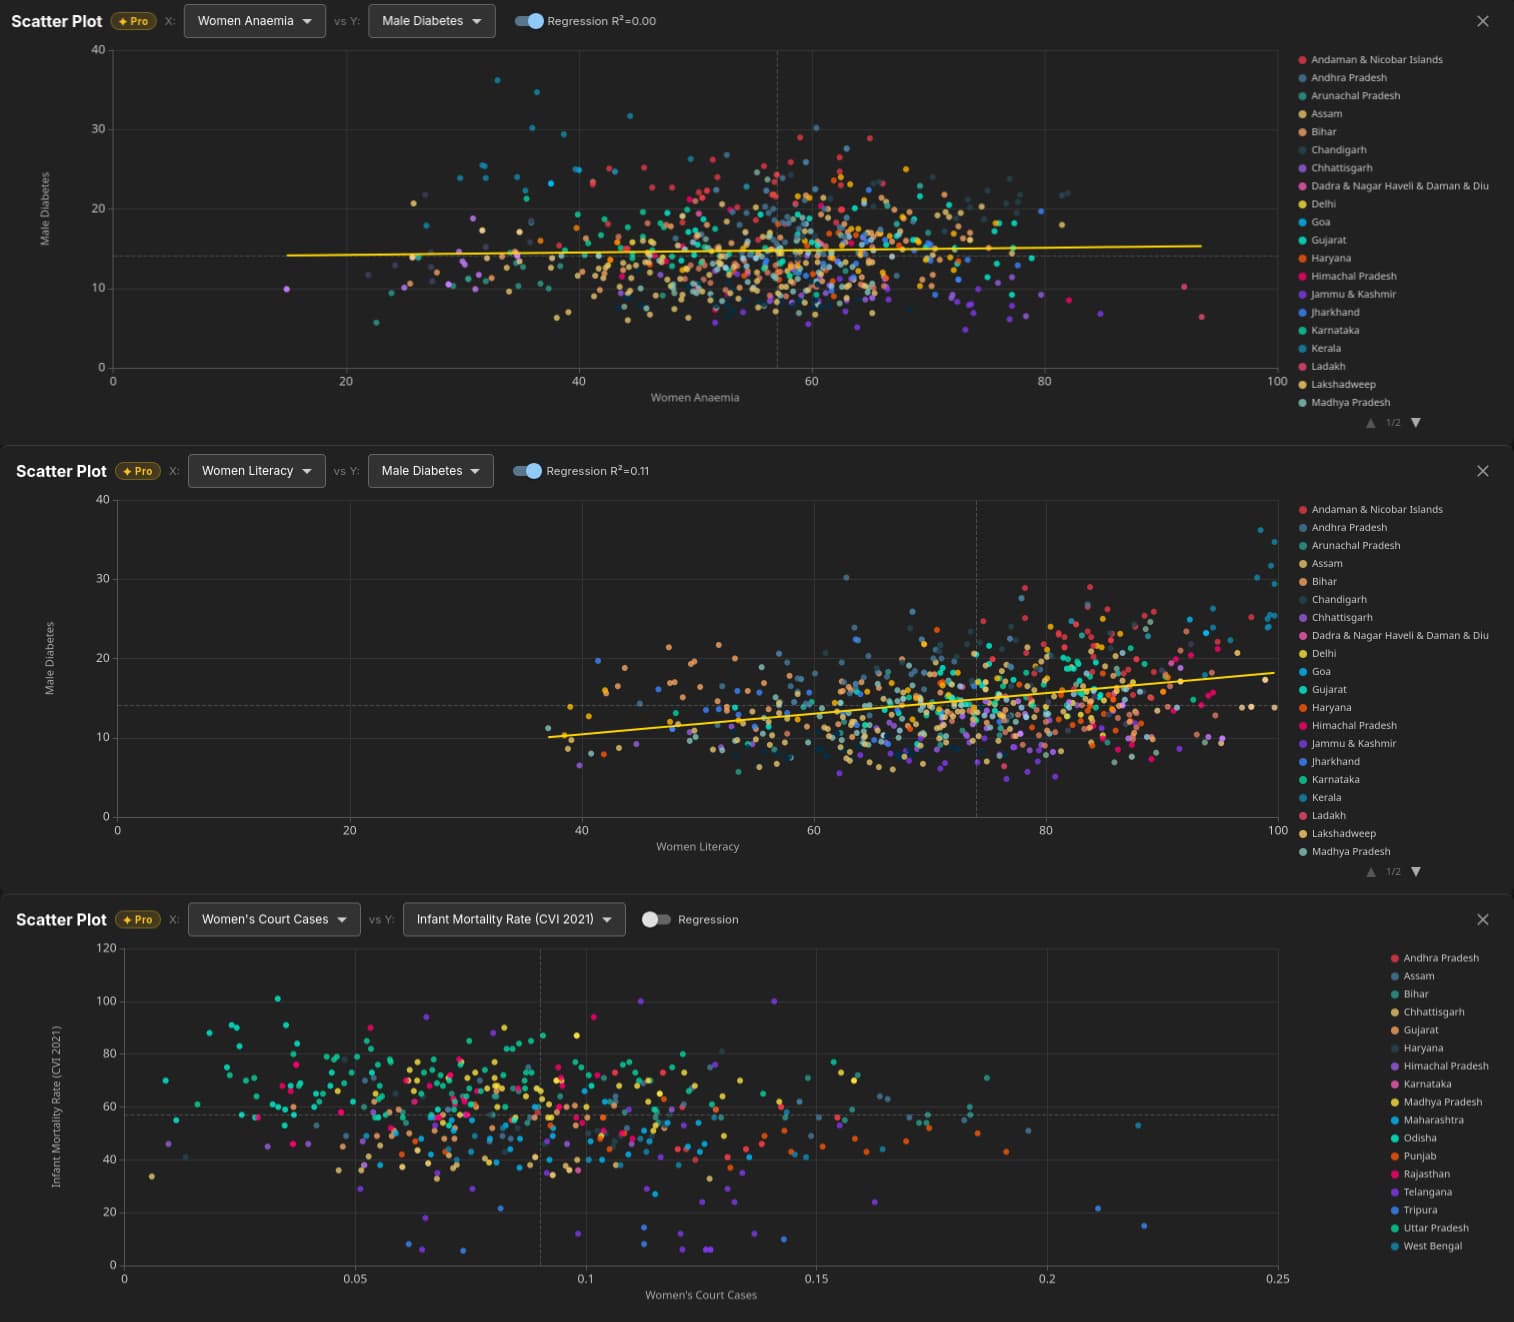
Scatter Plot with Regression
Plot any two district-level indicators against each other. OLS regression line with R² displayed in the header. Points coloured by state. Hover to identify individual districts. Filter to a single state to test sub-national patterns.
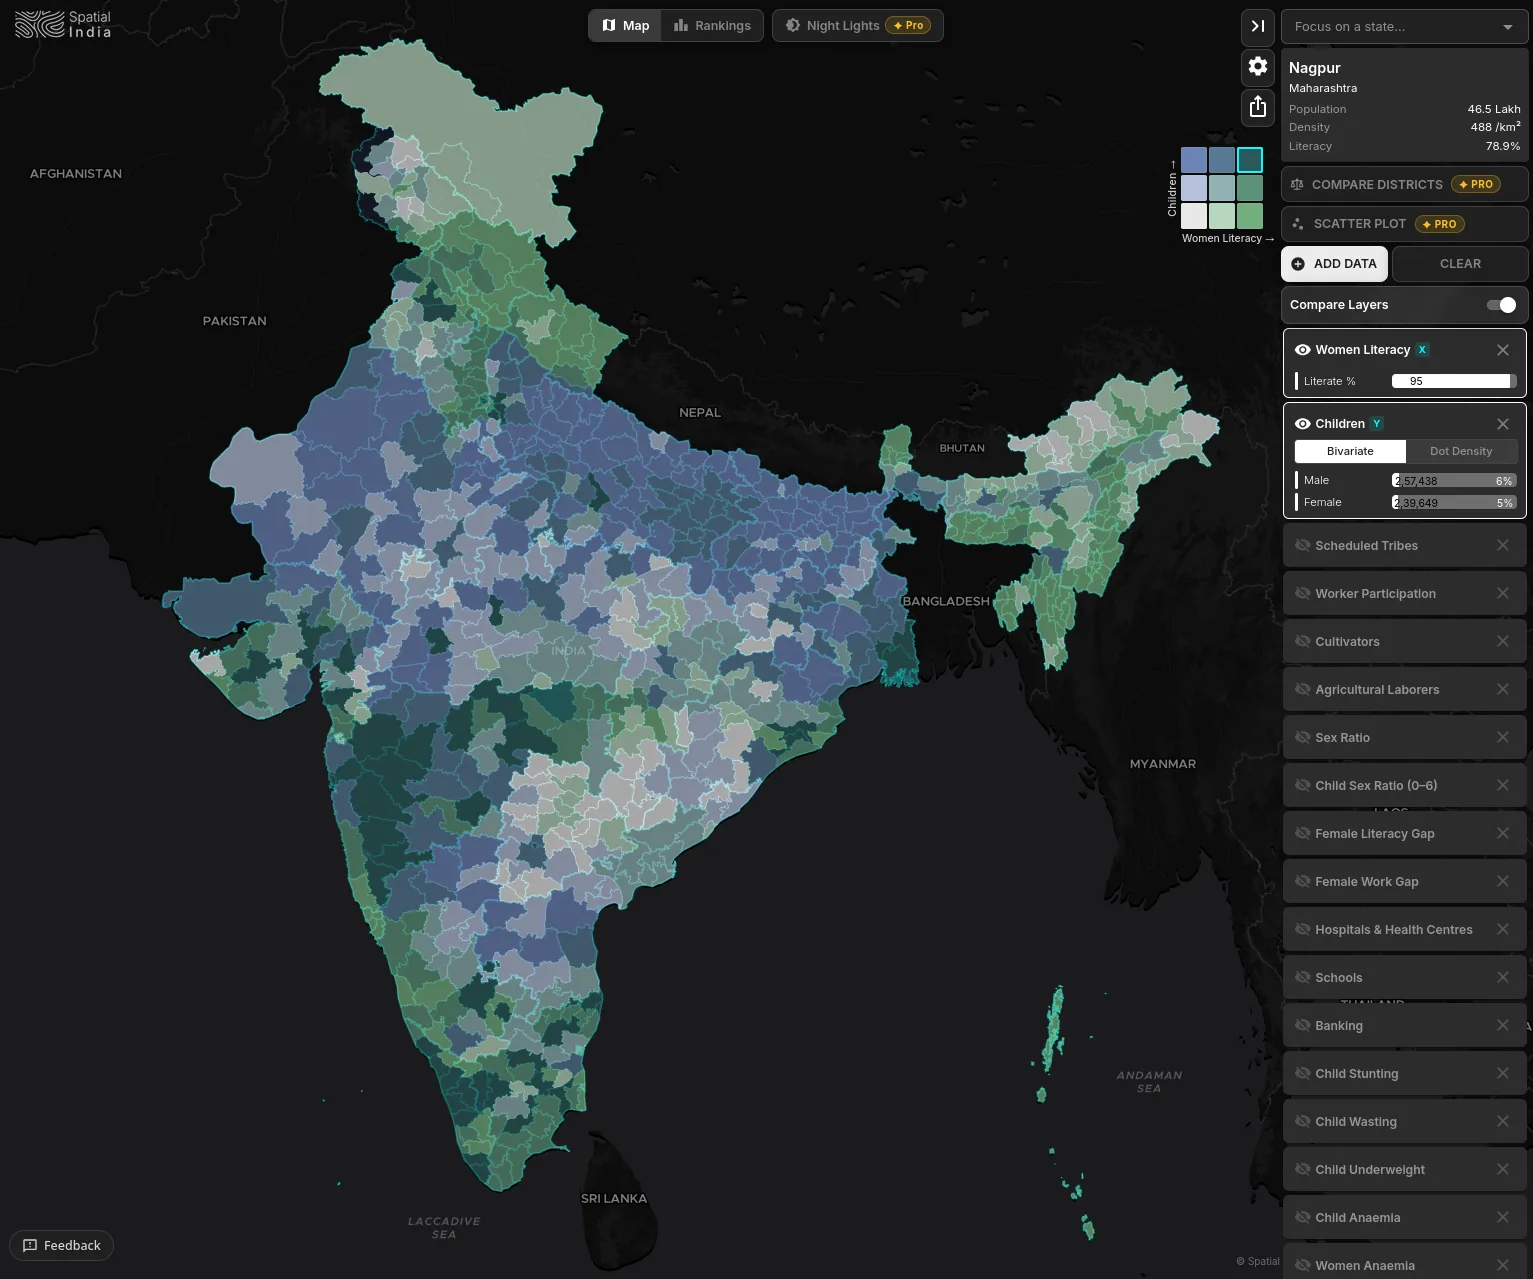
Bivariate Choropleth
Map two variables simultaneously using a 3×3 colour matrix — the Stevens canonical bivariate choropleth. Tertile classification, automatic palette selection based on variable polarity, and click-to-isolate filtering by cell.
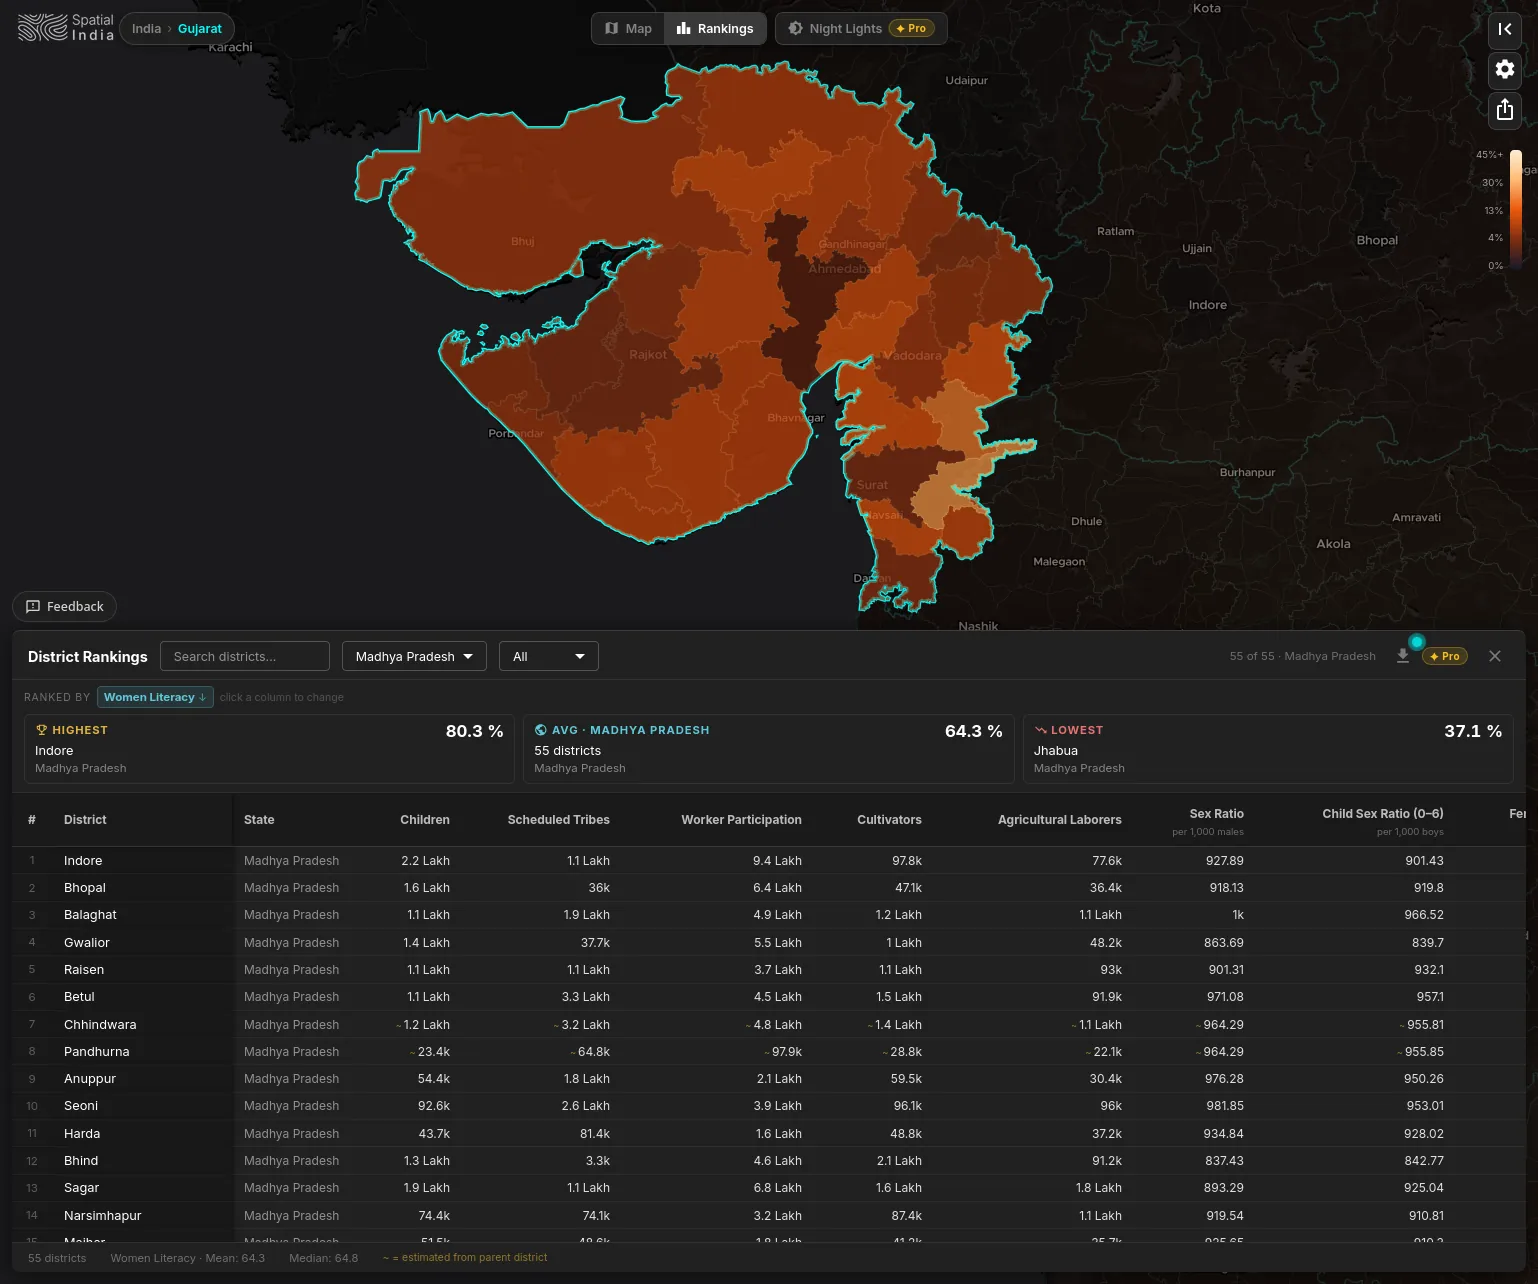
District Rankings with Percentiles
Sort all 800+ districts by any indicator. See national percentile, state rank, mean, and median. Filter by state or top/bottom N. Export to CSV for further analysis in R, Stata, or Python.
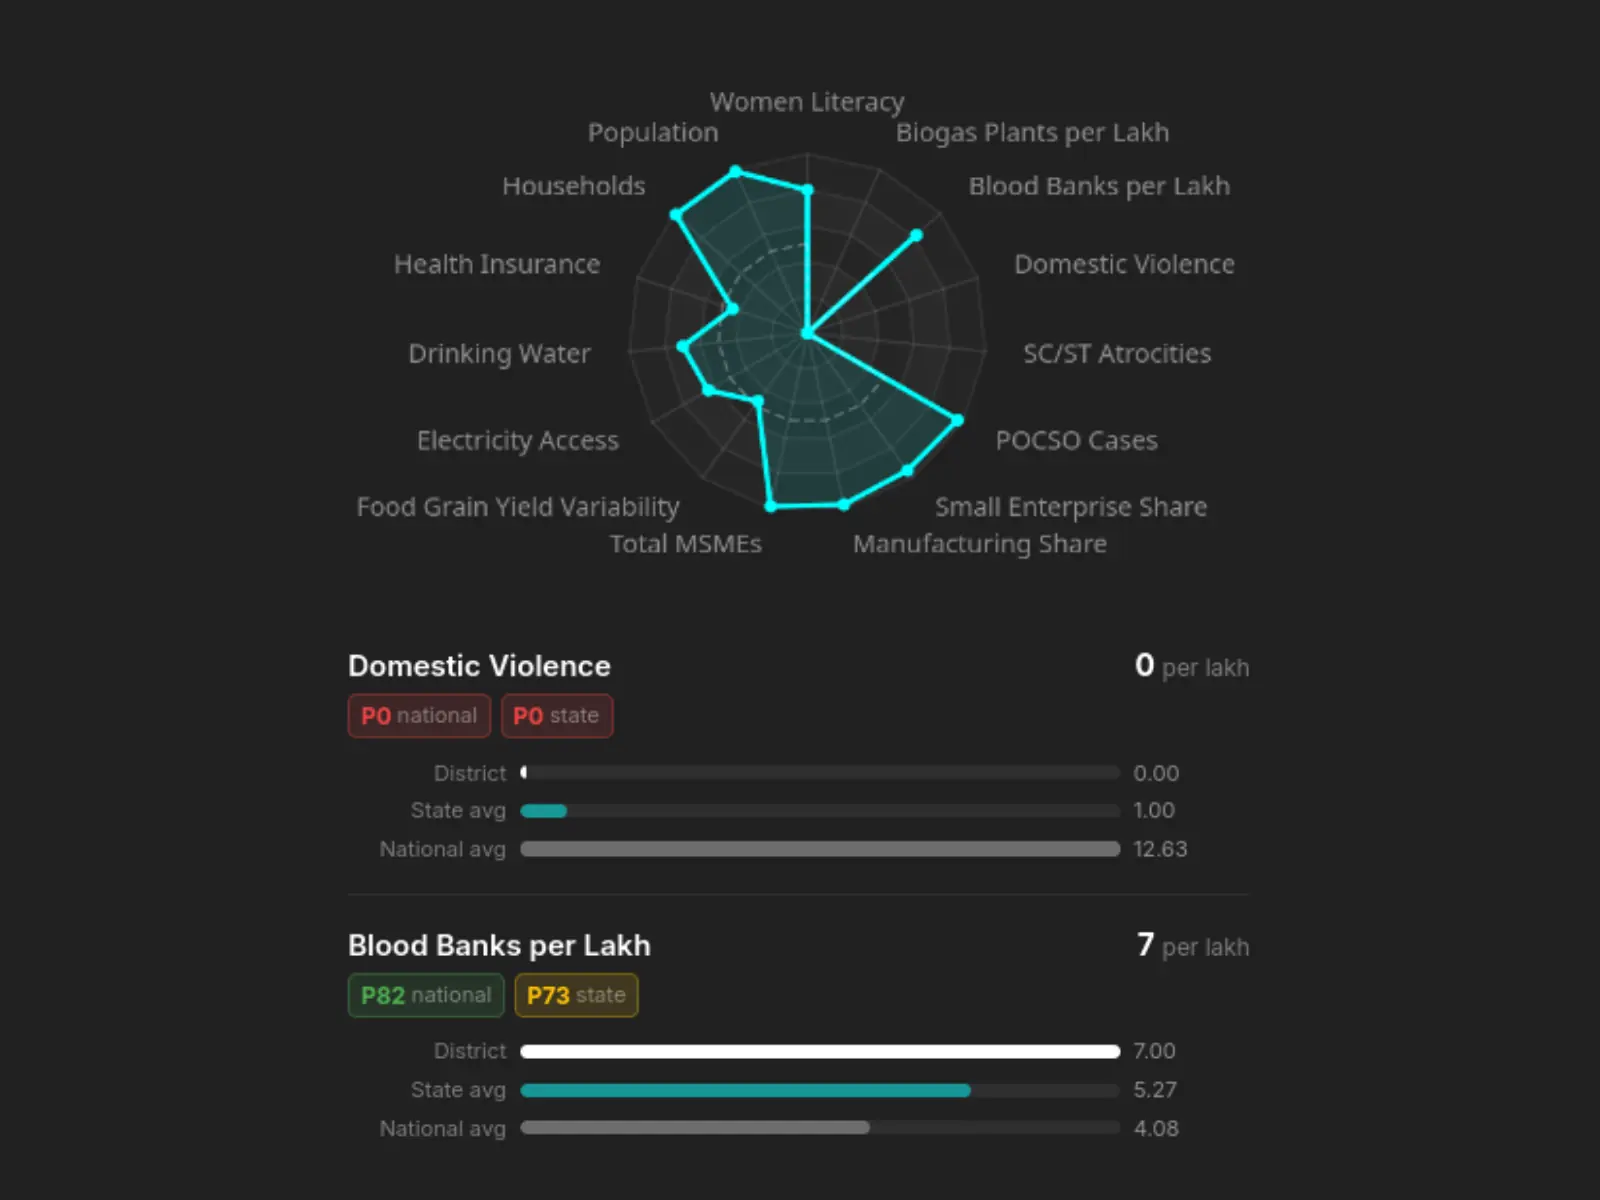
District Profile & National Distribution
Click any district to open a full statistical profile: radar chart showing percentile position across all active indicators, comparison bars against state and national averages, and a national distribution curve pinpointing where the district falls. A single-click equivalent of computing z-scores and plotting kernel densities across every variable.
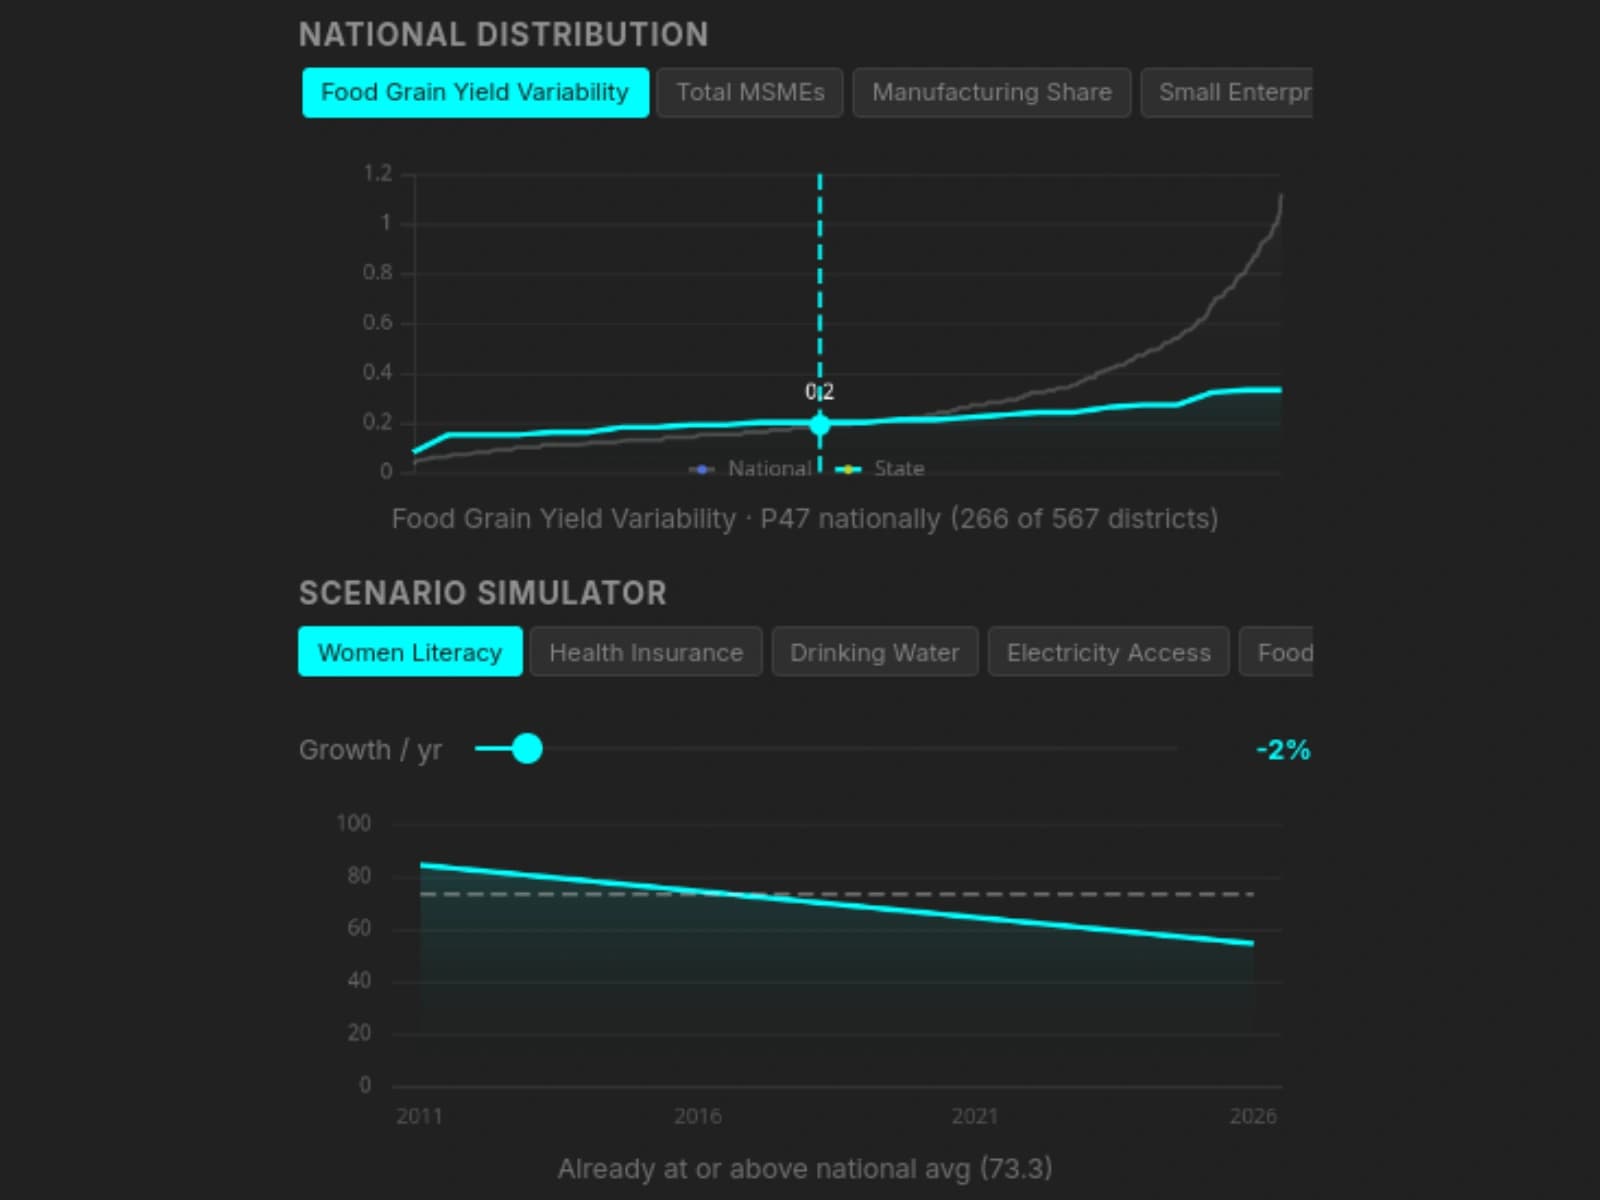
Scenario Simulator
Model how a district-level indicator evolves under different annual growth assumptions. Adjust the growth rate and see projected trajectories against state and national baselines — useful for sensitivity analysis in policy evaluation papers or for illustrating convergence and divergence hypotheses in development research.
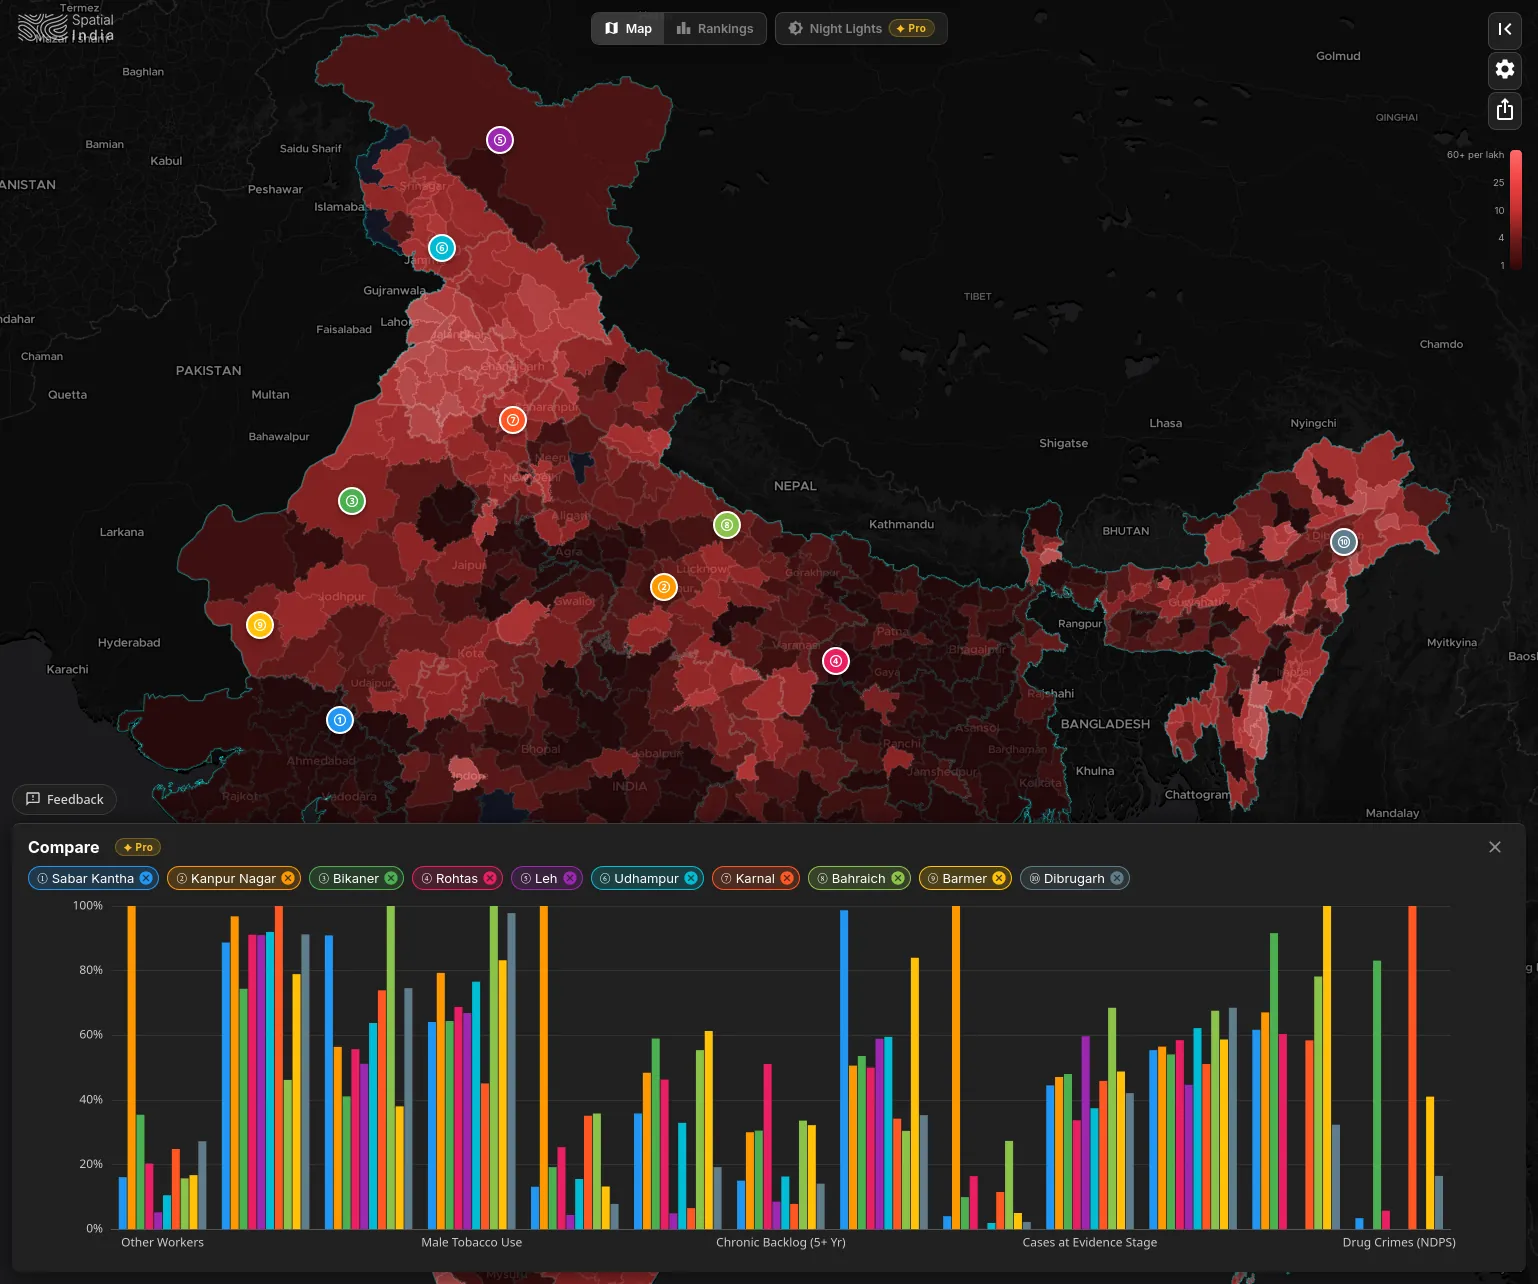
District Comparison
Pin any set of districts and compare them side-by-side across every active indicator on normalised bar charts. Useful for validating regional typologies, selecting control districts for quasi-experimental designs, or benchmarking study areas against state and national distributions — without exporting to R or Stata first.
SOURCES YOU KNOW AND TRUST
WHAT YOU CAN DO IN MINUTES
Explore spatial correlations
Pick any two indicators and scatter-plot them across 800+ districts. Test whether night-time light intensity predicts literacy. Check if vaccination coverage correlates with institutional births. See the R² before committing to a deeper analysis.
Generate publication-ready maps
Create choropleth maps with proper colour ramps, legend, and source attribution. Export as PNG for your paper or presentation. No QGIS, no shapefile downloads, no styling setup.
Teach spatial analysis without software barriers
Point students at the URL. No installation, no licenses, no lab setup. They can explore bivariate mapping, regression, and district ranking from any browser. Focus seminar time on interpretation, not software troubleshooting.
HOW SPATIALINDIA COMPARES
| Feature | Research Data Platforms | Government Data Portals | Desktop GIS / Scripting | |
|---|---|---|---|---|
| Interactive choropleth mapping | Any indicator, one click | (basic) | (manual setup) | |
| Scatter plot with regression | OLS with R², state filtering | (scripted) | ||
| Bivariate choropleth (two-variable) | 3×3 matrix, automatic palette | (plugin required) | ||
| 10+ national datasets, unified | Census, NFHS-5, VIIRS, NJDG & more | |||
| Works in your browser, zero setup | No install, no license, no lab setup | (static portal) | ||
| CSV & map export | CSV data + PNG maps with attribution | (raw tables) | (raw Excel) | |
| Side-by-side district benchmarking | Pin up to 10 districts, compare instantly | |||
| District ranking with percentiles | Sort 800+ districts, see percentiles | |||
| Census 2027 ready | Architecture ready, day-one support |
Spatial India vs Research Data Platforms
Spatial India vs Government Data Portals
Spatial India vs Desktop GIS / Scripting
Skip the data wrangling. Start the analysis.
Free to explore, with full source attribution on every map. All data from authoritative public sources under NDSAP guidelines.
Census 2027 early access — be first to explore the new data.