SPATIAL INDIA FOR CONSULTING & FMCG
Market intelligence at the granularity of a district
Size any Indian market by demographics, economic activity, and infrastructure — across all 800+ districts. Census demographics enriched with NFHS-5 (2021) health data and NASA night-time lights (2024) for current economic activity signals. Answers in minutes, not consulting-week Excel models.
WHY DISTRICT-LEVEL STRATEGY IS STILL MANUAL
Market sizing runs on Excel and guesswork
Your analyst is pulling population from Census India, banking density from RBI, economic proxies from wherever they can find them — then manually joining everything in a spreadsheet. The district-level picture takes days to assemble.
The right tools cost ₹7 lakh or need developers
Enterprise GIS starts at ₹7L/year and needs trained GIS staff. Map APIs require a developer to build anything. Retail analytics platforms focus on AI scoring. Nothing lets a strategy consultant explore Indian demographics self-serve.
Tier-2/3 expansion decisions lack spatial context
Which districts have high population density but low banking penetration? Where is economic activity growing fastest? Tables and bar charts don't answer spatial questions — you need to see the map.
FROM DATA TO DISTRICT STRATEGY
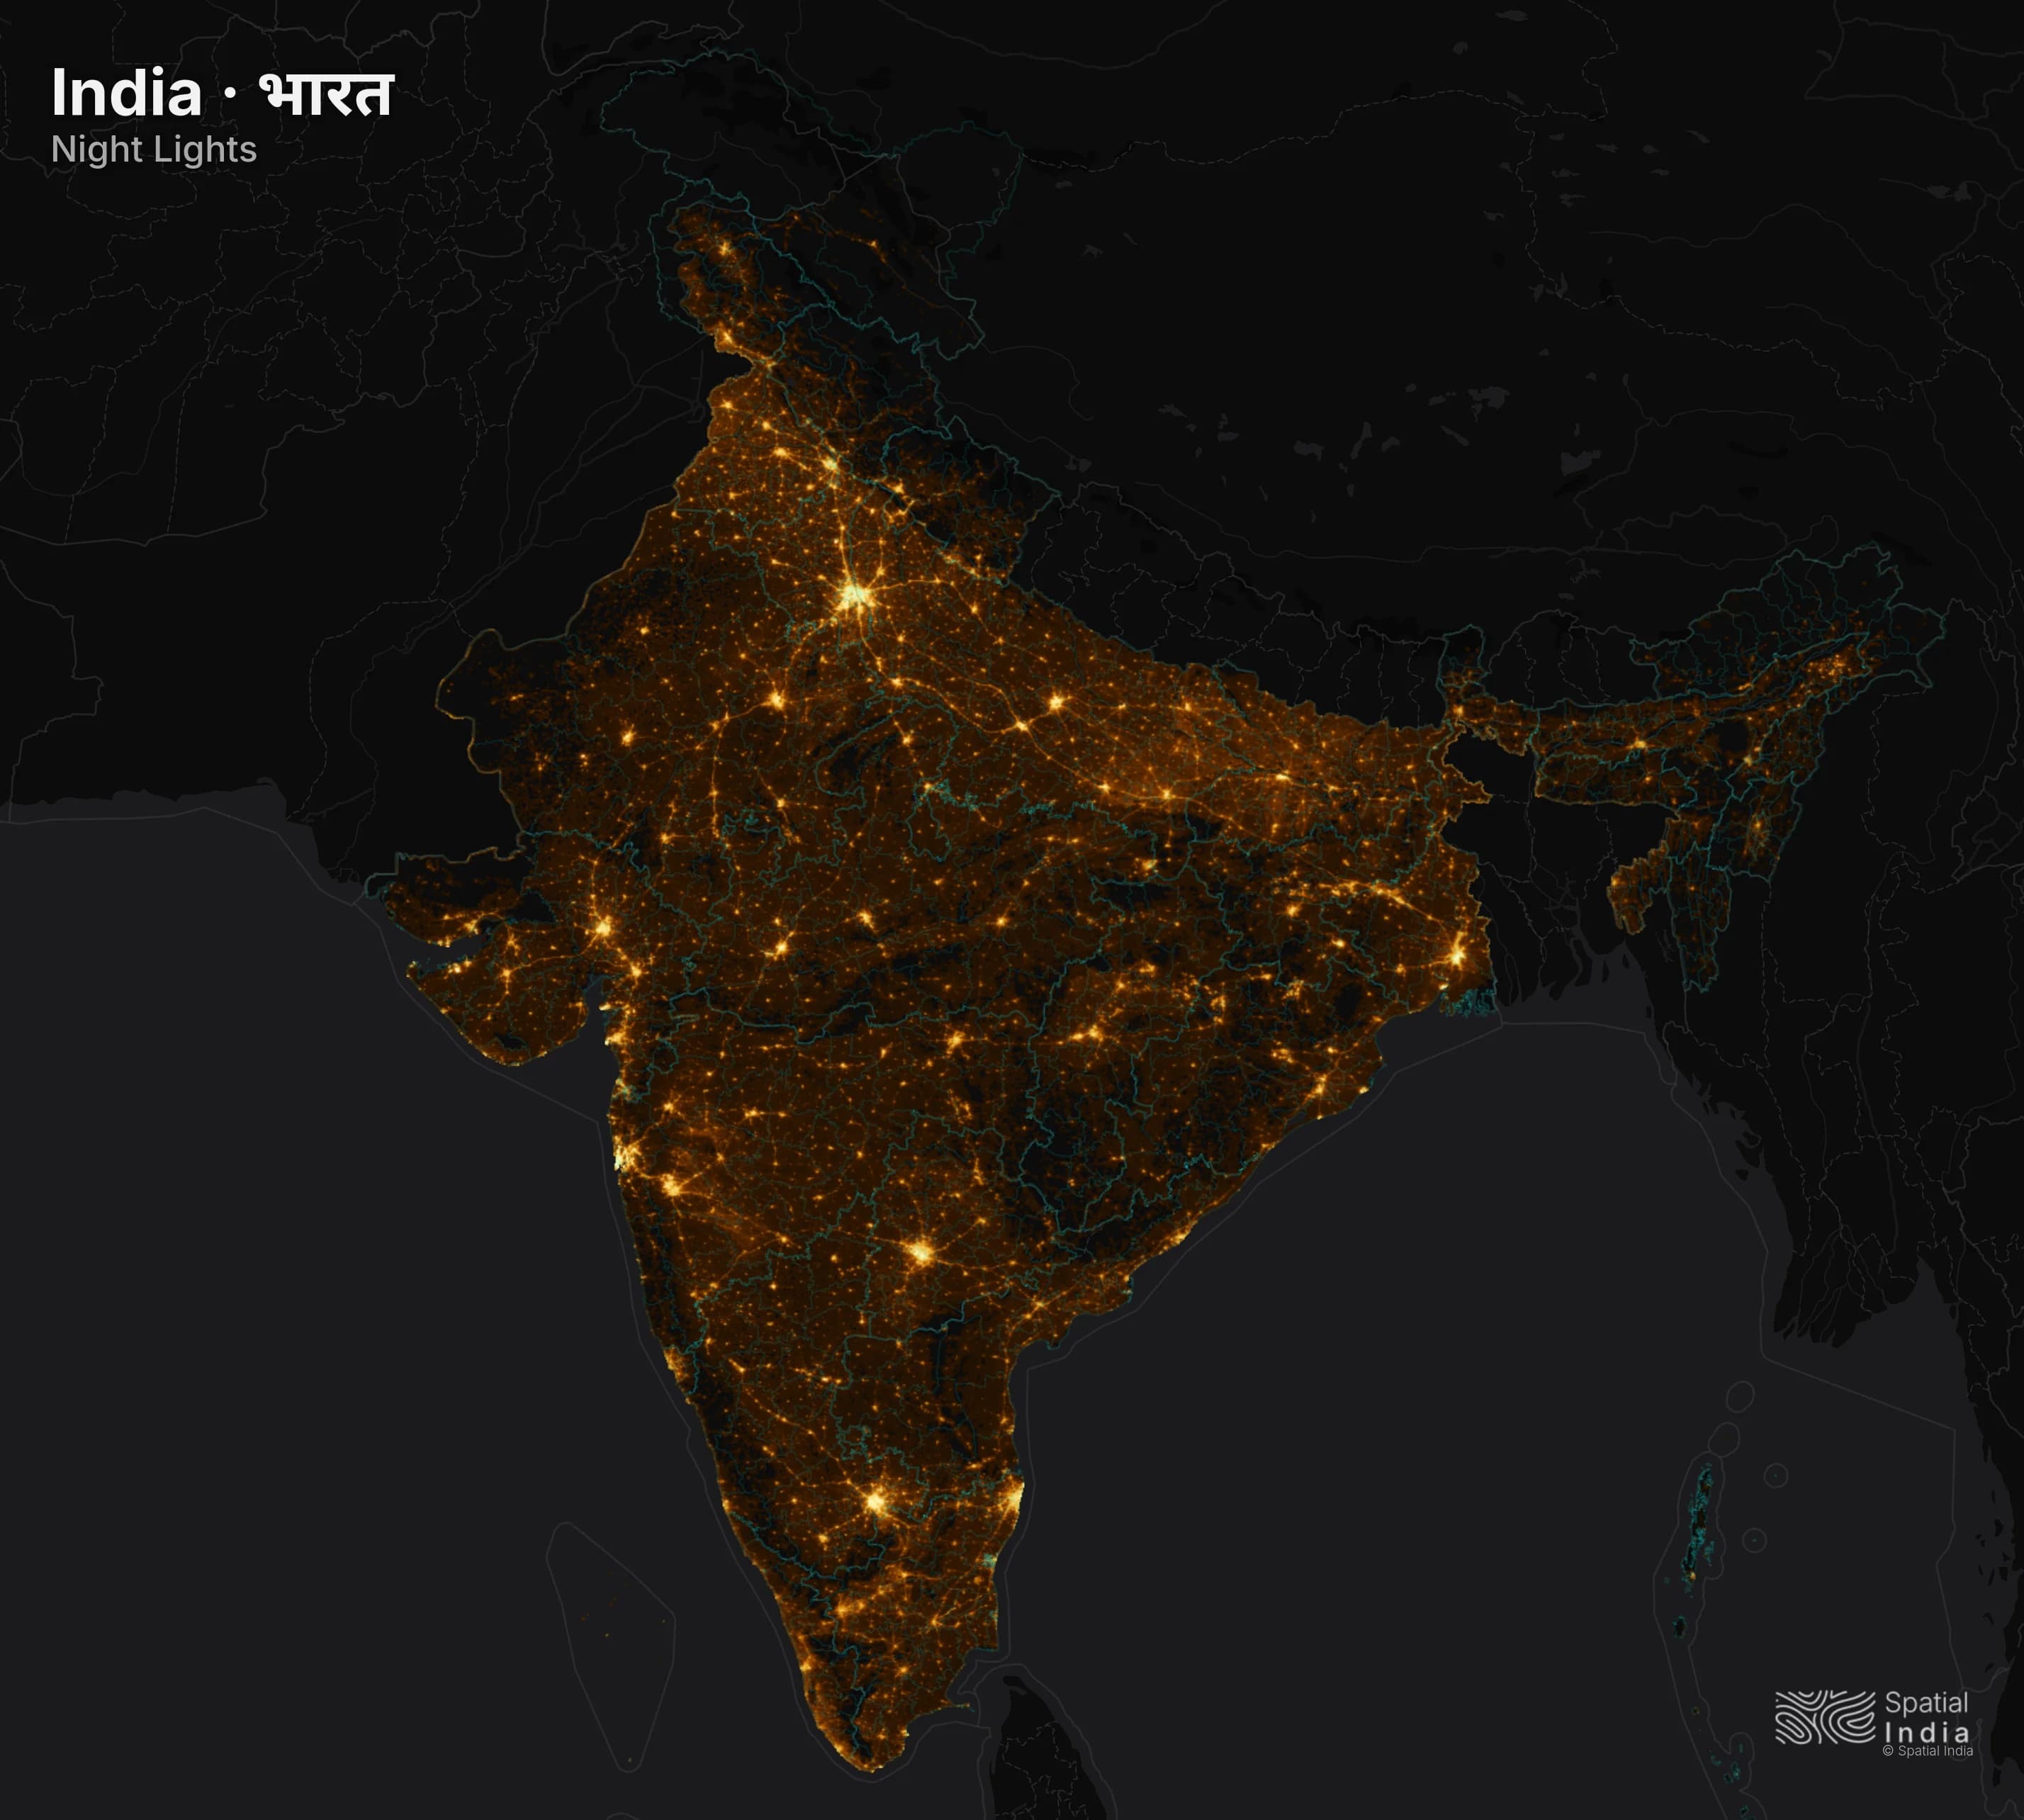
Night-time Lights (Economic Activity Proxy)
Overlay NASA satellite data showing light intensity — a proven proxy for economic activity — across all districts. Ten years of annual data (2015–2024). Identify which Tier-2/3 markets are growing before official GDP data catches up.
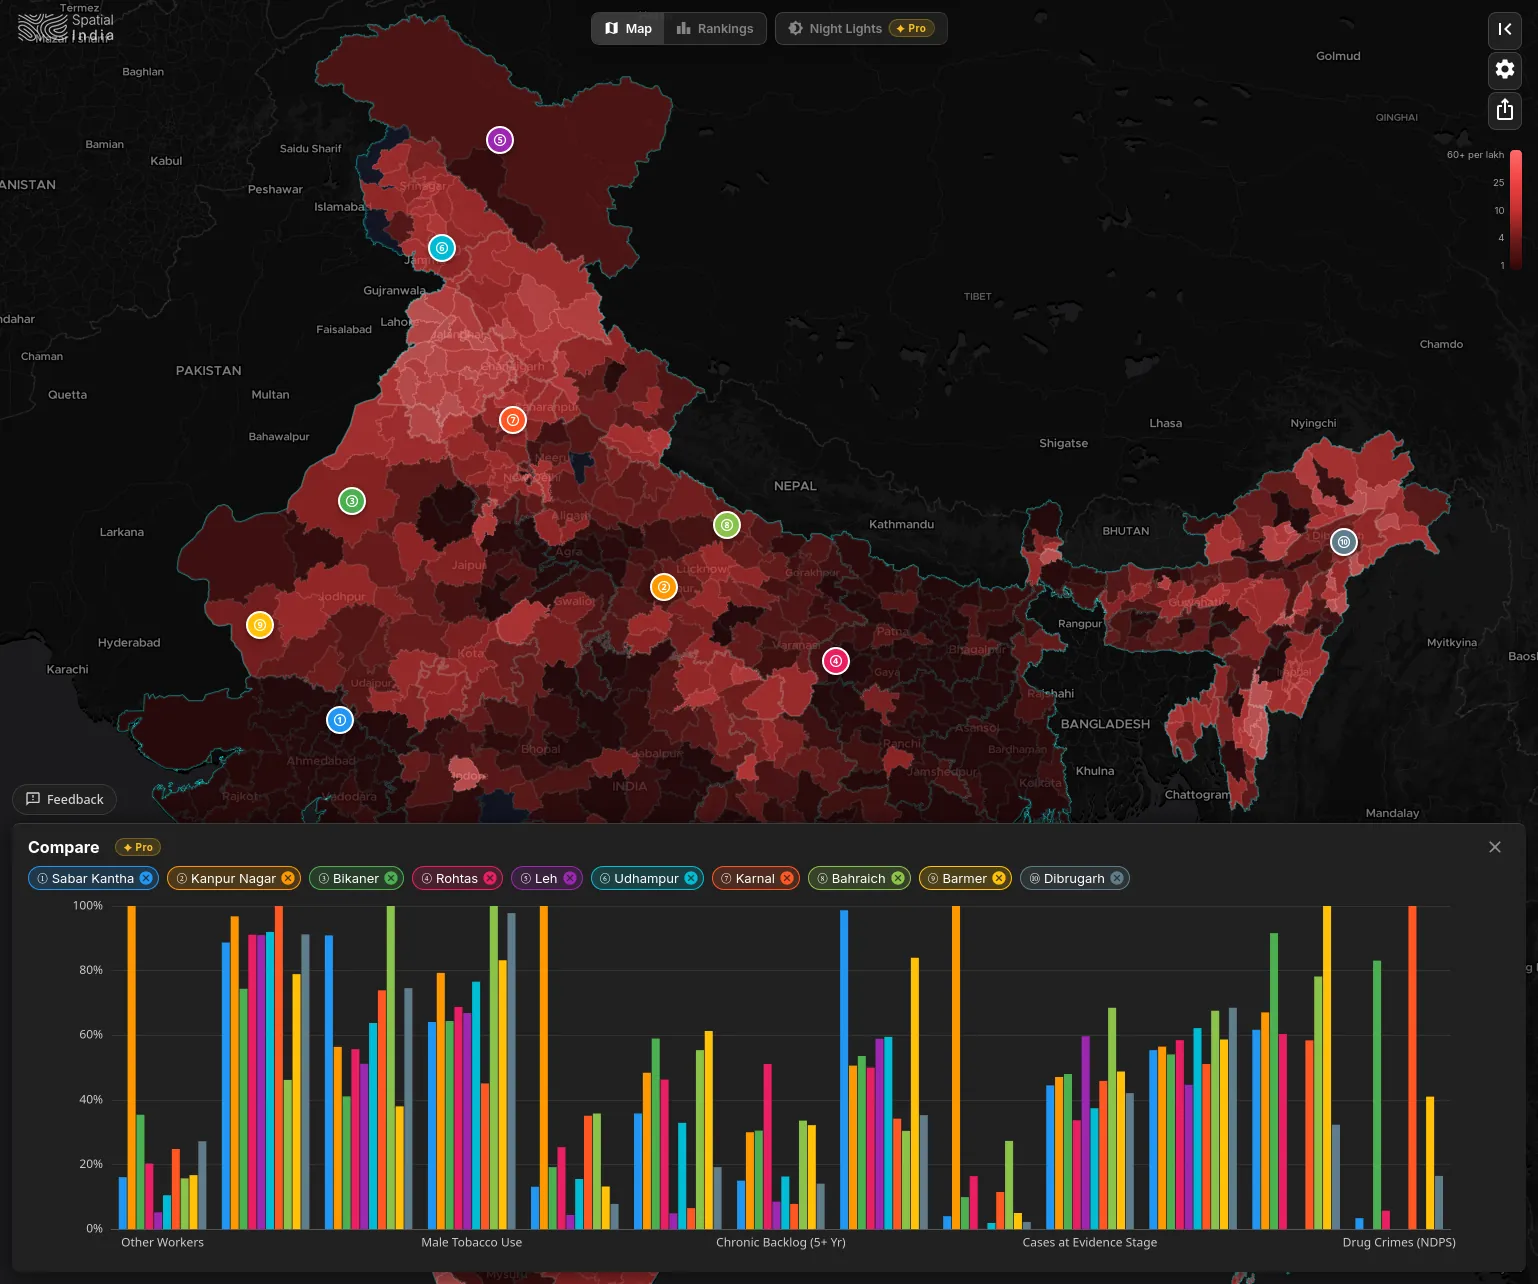
District Comparison Panel
Pin any 10 districts and benchmark them across every metric — population, literacy, banking density, worker participation, night-light intensity. Normalised bar charts ready for your next client slide.
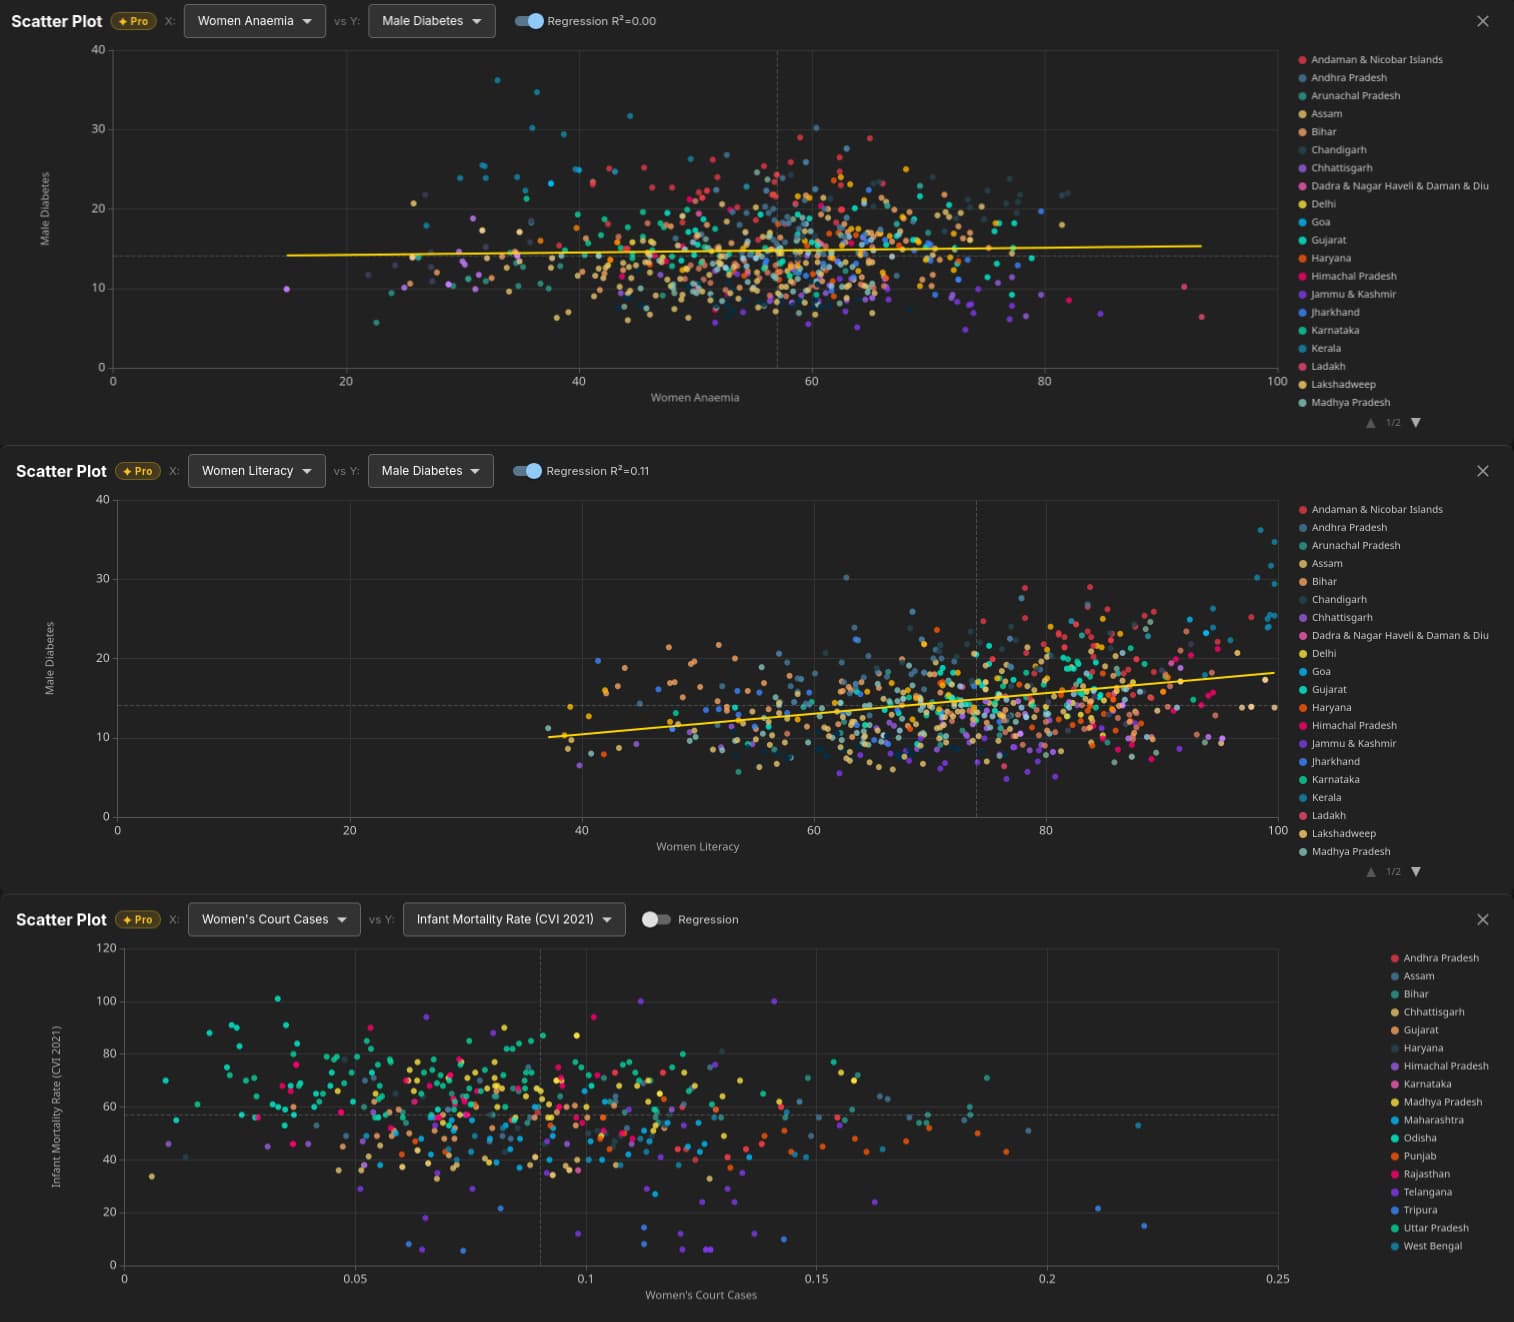
Scatter Plot Correlation
Plot population density against banking penetration. Worker participation against night-light intensity. Find the districts where demand indicators are high but supply is thin — your white-space opportunities, visualised.
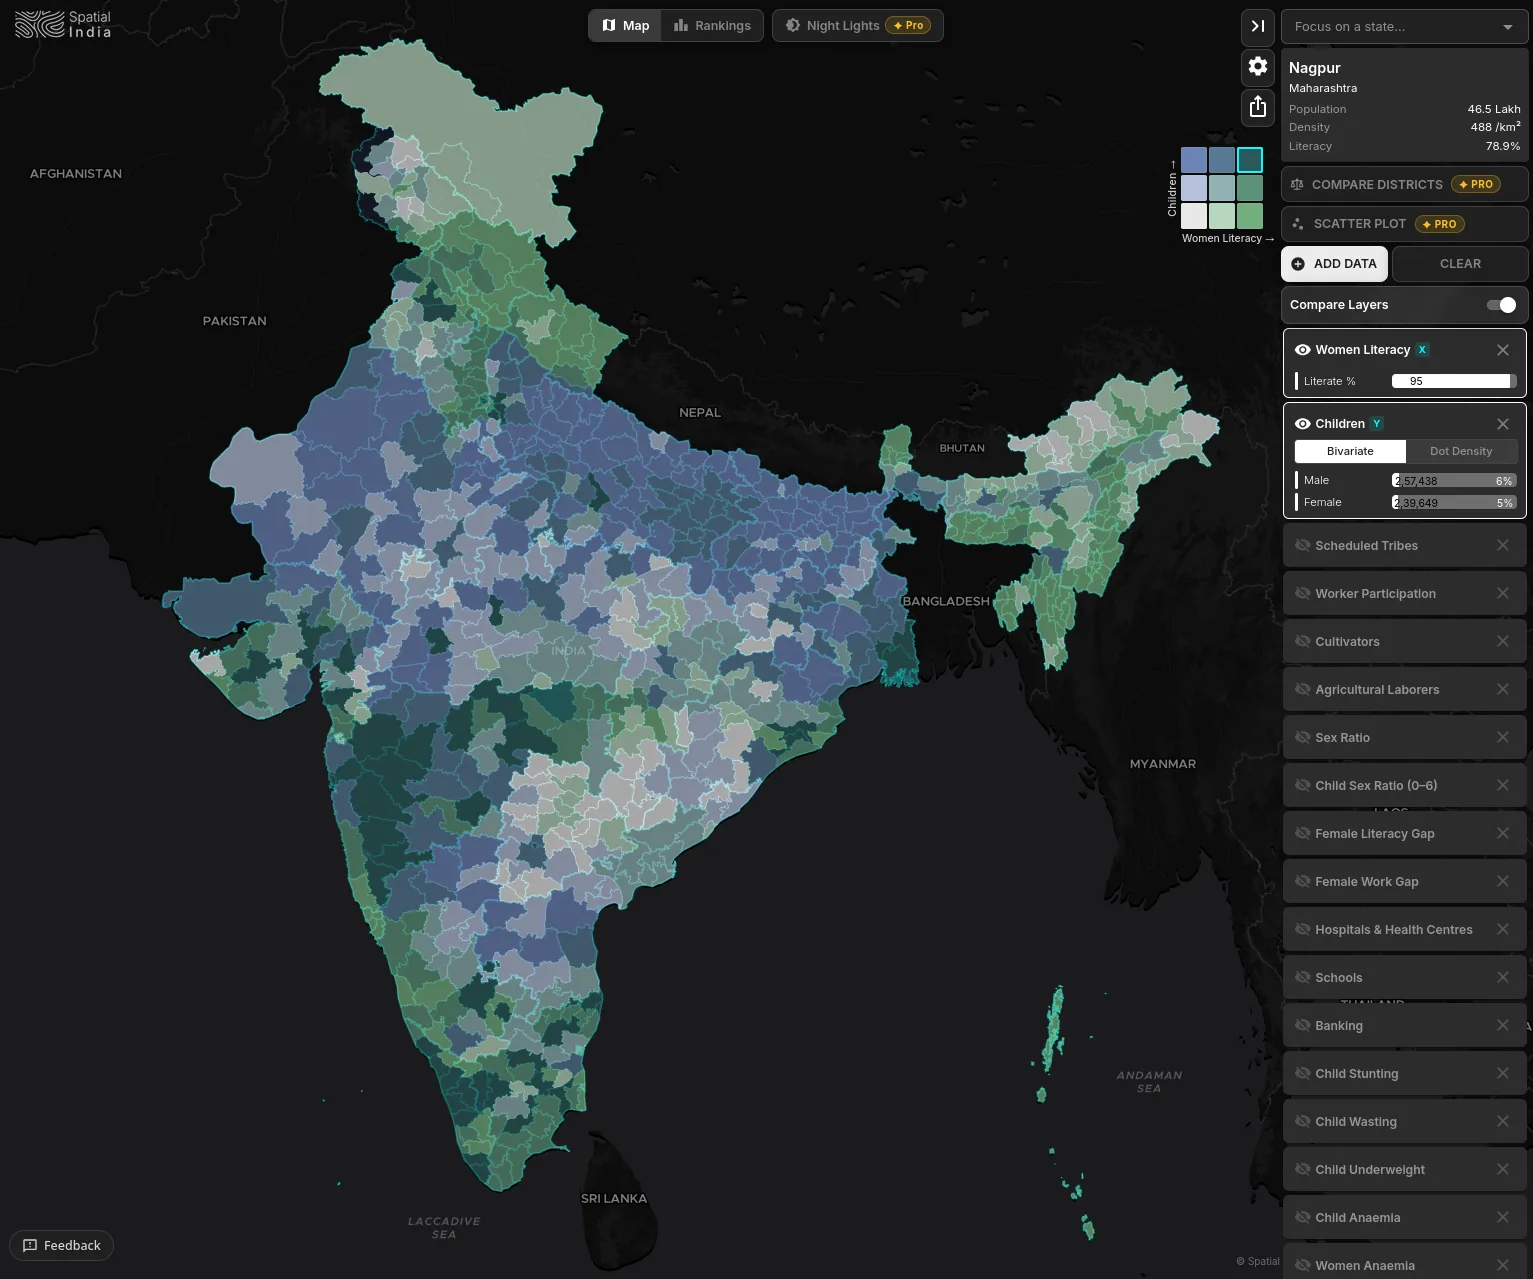
Bivariate Analysis
Map two variables simultaneously: high population + low banking, or high literacy + low MSME registration. The 3×3 colour matrix shows exactly which districts sit in the sweet spot for your expansion criteria.
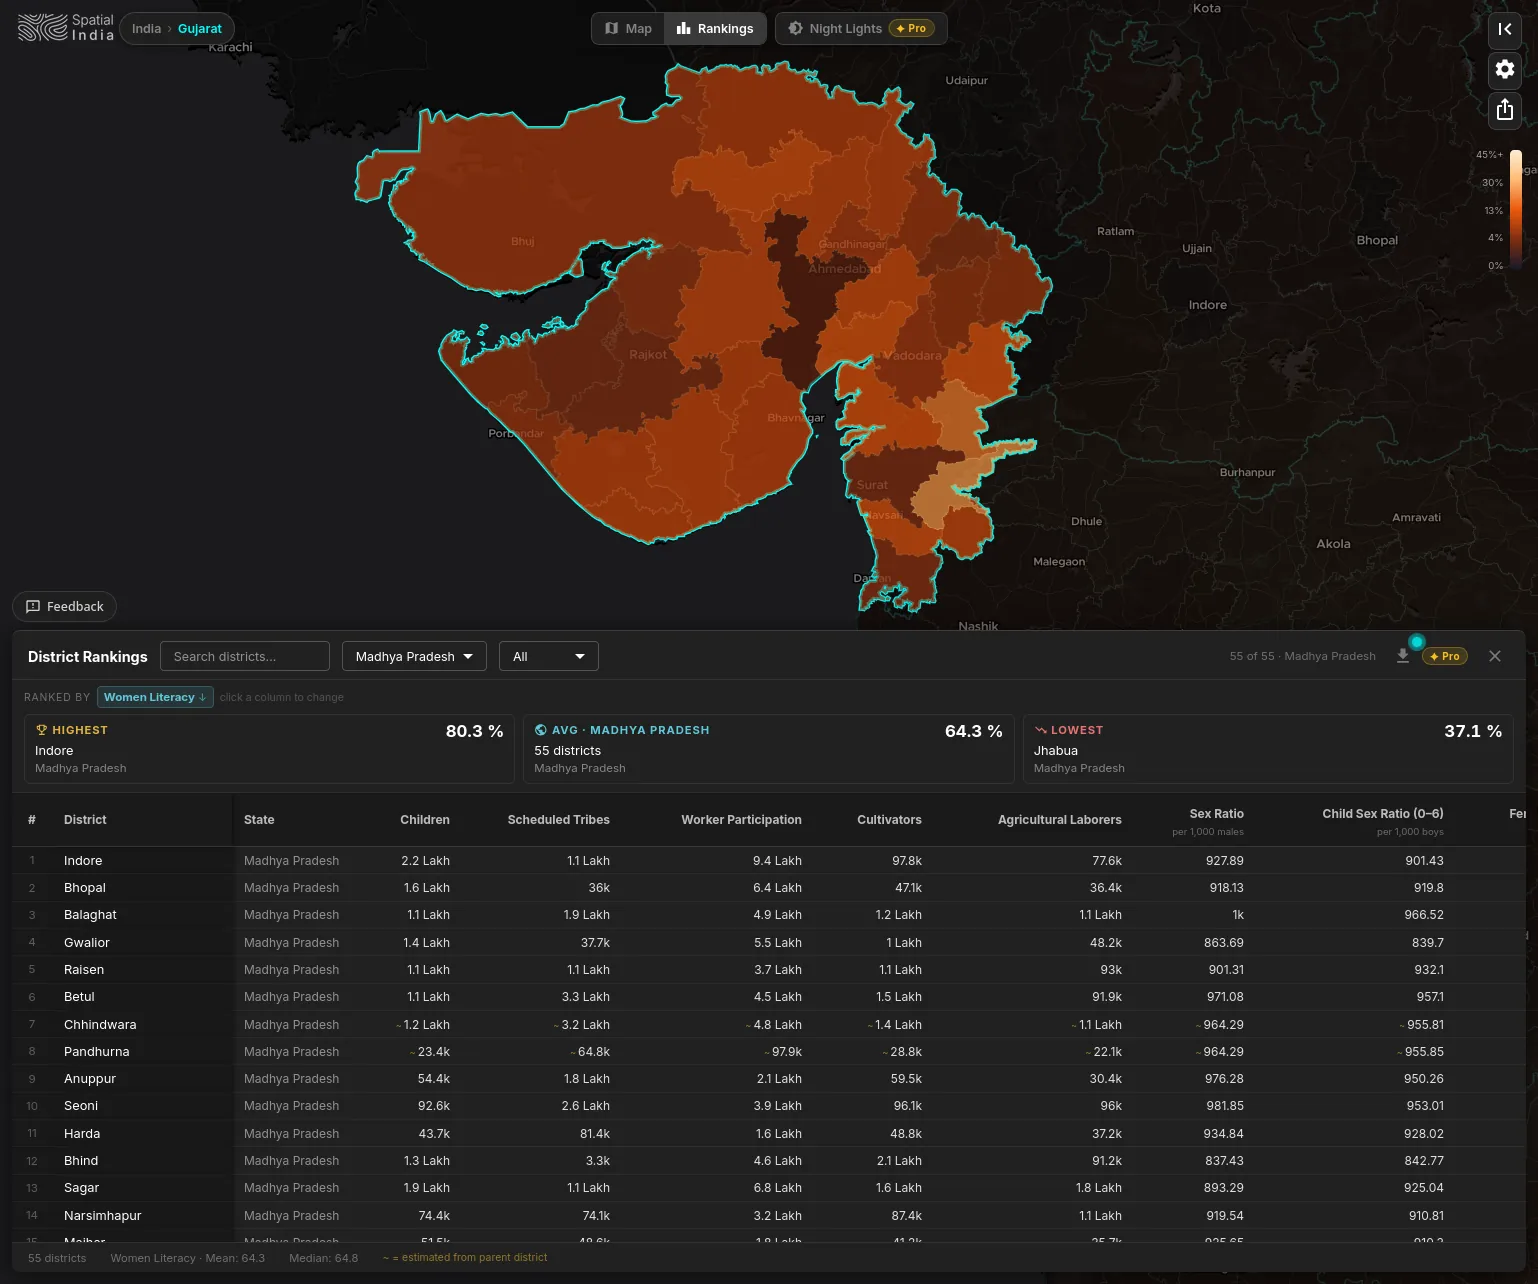
State Focus Drill-Down
Click any state to zoom in and see only its districts. Rank them, compare them, and scatter-plot them within that state's context. Perfect for state-level market entry reports.
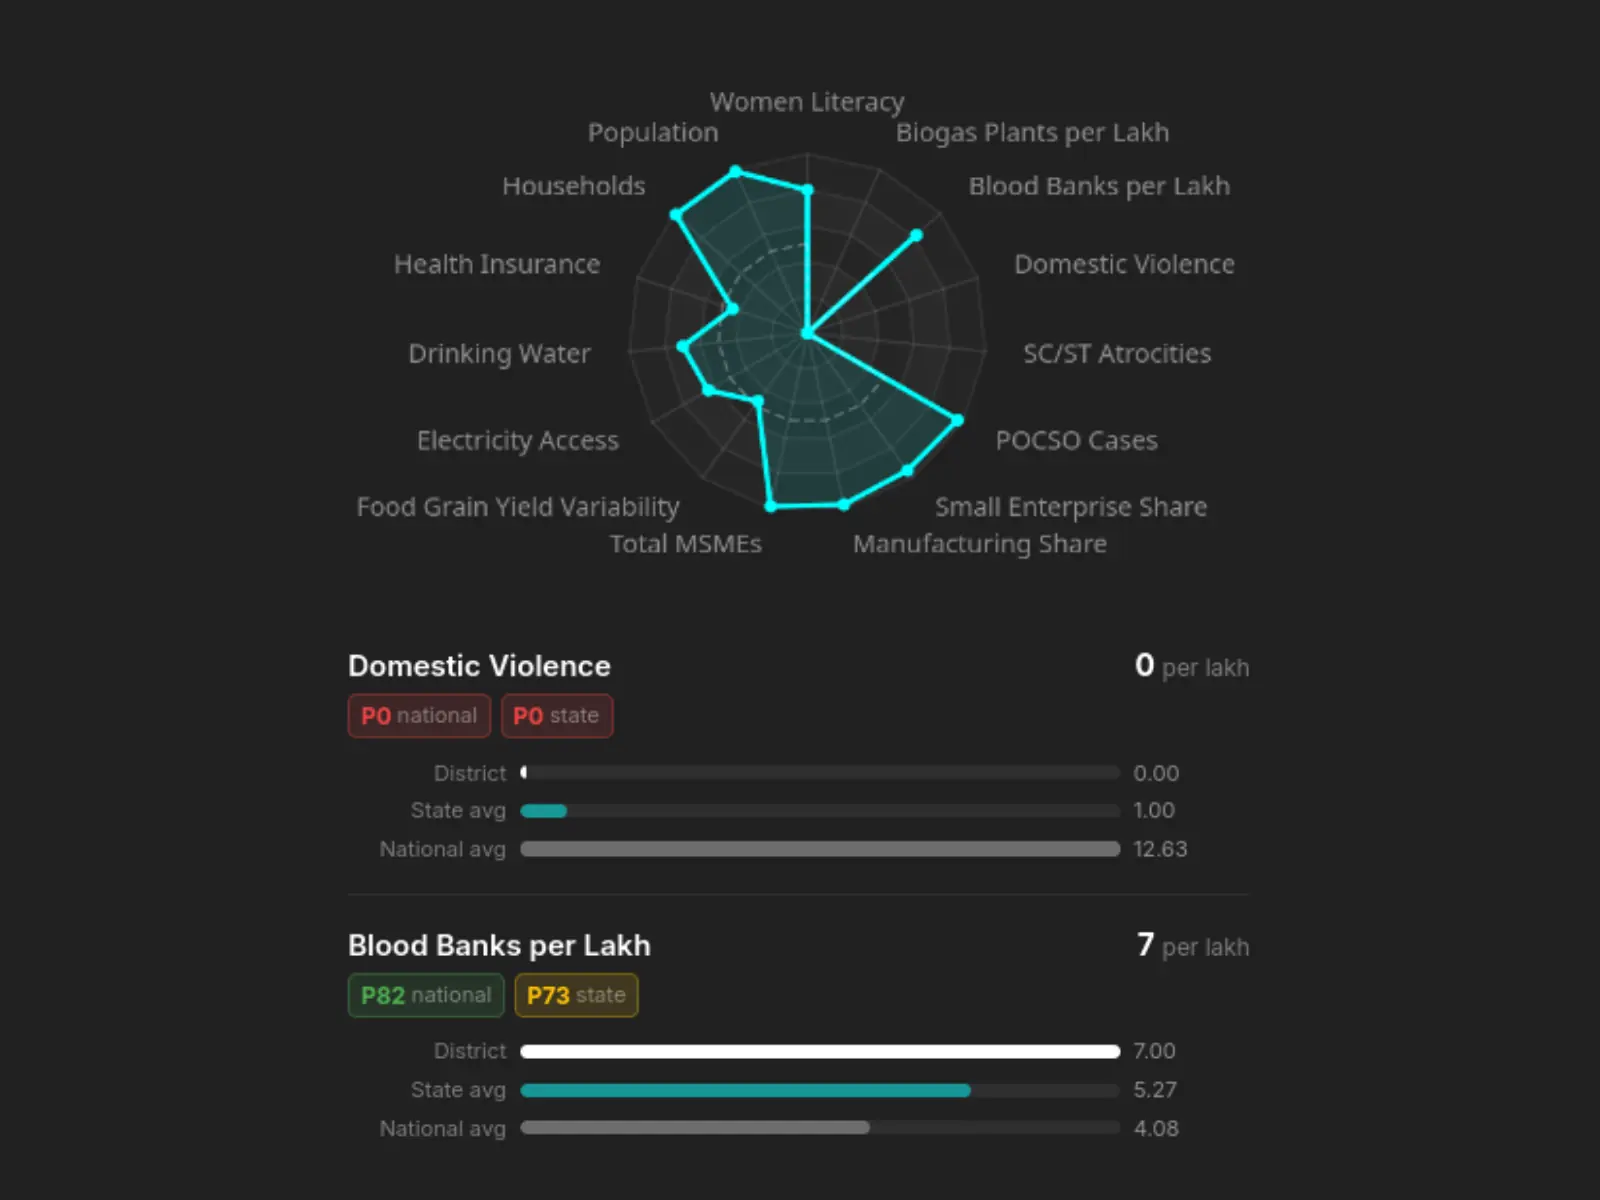
District Profile
Click any district for a full statistical snapshot: radar chart across all active indicators, percentile rankings against state and national averages, and comparison bars showing where it leads or lags. A ready-made district brief for your next client presentation.
THE DATASETS THAT DRIVE EXPANSION DECISIONS
WHAT YOUR TEAM CAN DELIVER
Tier-2/3 market sizing
Rank districts by population, economic activity (night lights), and infrastructure. Filter by state. Export the ranking table as CSV for your model. A district-level TAM estimate that used to take a week — done in an afternoon.
White-space analysis for FMCG expansion
Use bivariate mapping to find districts with high population density but low retail or banking presence. Scatter-plot demand indicators against supply indicators. The map shows the white space — the presentation writes itself.
Data-backed client deliverables
Export choropleth maps and comparison charts with source attribution for your slide deck. Pin the client's target districts and their competitors' districts. Show the evidence, not just the recommendation.
HOW SPATIALINDIA COMPARES
| Feature | Retail Analytics Platforms | Indian Map APIs | Enterprise GIS | |
|---|---|---|---|---|
| Self-serve, no developers needed | Open browser, start exploring | (retail-focused only) | (requires GIS training) | |
| Night-time lights economic proxy | NASA VIIRS 2015–2024, annual | (paid add-on) | ||
| Cross-indicator analysis | Scatter plots with R² & filtering | (requires expertise) | ||
| Side-by-side district benchmarking | Pin up to 10 districts, compare instantly | |||
| Two-variable mapping (bivariate) | 3×3 matrix, find sweet-spot districts | (manual configuration) | ||
| 10+ national datasets, unified | Census, NFHS-5, MSME, lights & more | (proprietary, closed) | (paid add-ons, ₹7L+/yr) | |
| District ranking & prioritization | Rank 800+ districts by any metric | |||
| Presentation-ready map exports | PNG with legend & source attribution | (manual cartography) | ||
| Census 2027 ready | Architecture ready, day-one support |
Spatial India vs Retail Analytics Platforms
Spatial India vs Indian Map APIs
Spatial India vs Enterprise GIS
District-level insight, delivered in minutes
Free during beta — currently in early access. No subscription, no API key, no software install. Explore the same districts your clients are asking about — with the data to back up your recommendation.
New district-level economic datasets — get early access.